


Predicting Recessions With Our Macro Matrix
10 Macro Indicators That Can Tell You When The Market Will Turn

Can We Predict Recessions?
Predicting bear markets is the panacea of investing. Everyone says you can’t time the market. But what if you could?
People talk about the miracle of long-term compounding to defend staying invested, but the lack of losses also compounds.
Avoiding a 10% downfall and then reinvesting near the bottom, would allow you to outperform a buy-and-hold strategy by a huge margin. Not to mention you can also make money on the downside.
But they say timing the market is impossible, or a skill only available to institutions with insider knowledge and access to privileged data. This is NOT TRUE
With the right approach, and thanks to the use of the right data and technology, we can indeed predict bear markets and recessions, and I will try to prove it here.
This is why I’m launching my Macro Matrix, using unique insights from MacroMicro. This is a system that I believe will help us determine the next bear market before it happens.
The Macro Matrix is made up of 10 key indicators that I will update weekly. Combined, these 10 key indicators will tell us if a recession is about to happen or imminent.
I’ll present them below, and show you where you can see the Macro Matrix
MM Manufacturing Cycle Index
First up, we have a metric developed in-house at MacroMicro.

MacroMicro integrates global manufacturing, retail, transportation, and trade-related data to compile the MM Manufacturing Cycle Index.
The MM Manufacturing Cycle Index divides the manufacturing cycle into four key stages:
Recovery Phase: The index is low but rising, indicating recovery.
Expansion Phase: The index rises above zero, signalling peak business activity and growth.
Decline Phase: The index remains above zero but starts falling, showing slowing growth.
Destocking Phase: The index drops below zero, indicating a significant downturn.
These cycles, recurring every 3-4 years, impact global markets, often influencing the MSCI ACWI, particularly during downturns and upswings.
As we can see, tops and bottoms this indicator can quite accurately predict turns in the market.
For example, the index topped and began to fall ahead of the 2000 bear market, and also gave us a warning “divergence” leading up to 2008, with Manufacturing trending lower as stocks rose higher, and finally breaking down as the index fell below 0.
Taiwan Exports

Taiwan’s export growth is a crucial leading indicator for the MSCI ACWI Index, reflecting its upstream position in the global supply chain.
Historically, peaks in Taiwan’s exports have preceded high points in global stock markets, as seen in 2010, 2014, 2017, and 2021. Taiwan’s ability to sense changes in manufacturing demand allows its export performance to predict global corporate profits and stock market trends. This makes it a valuable signal for global economic shifts and stock performance analysis.
Earnings Revision Index
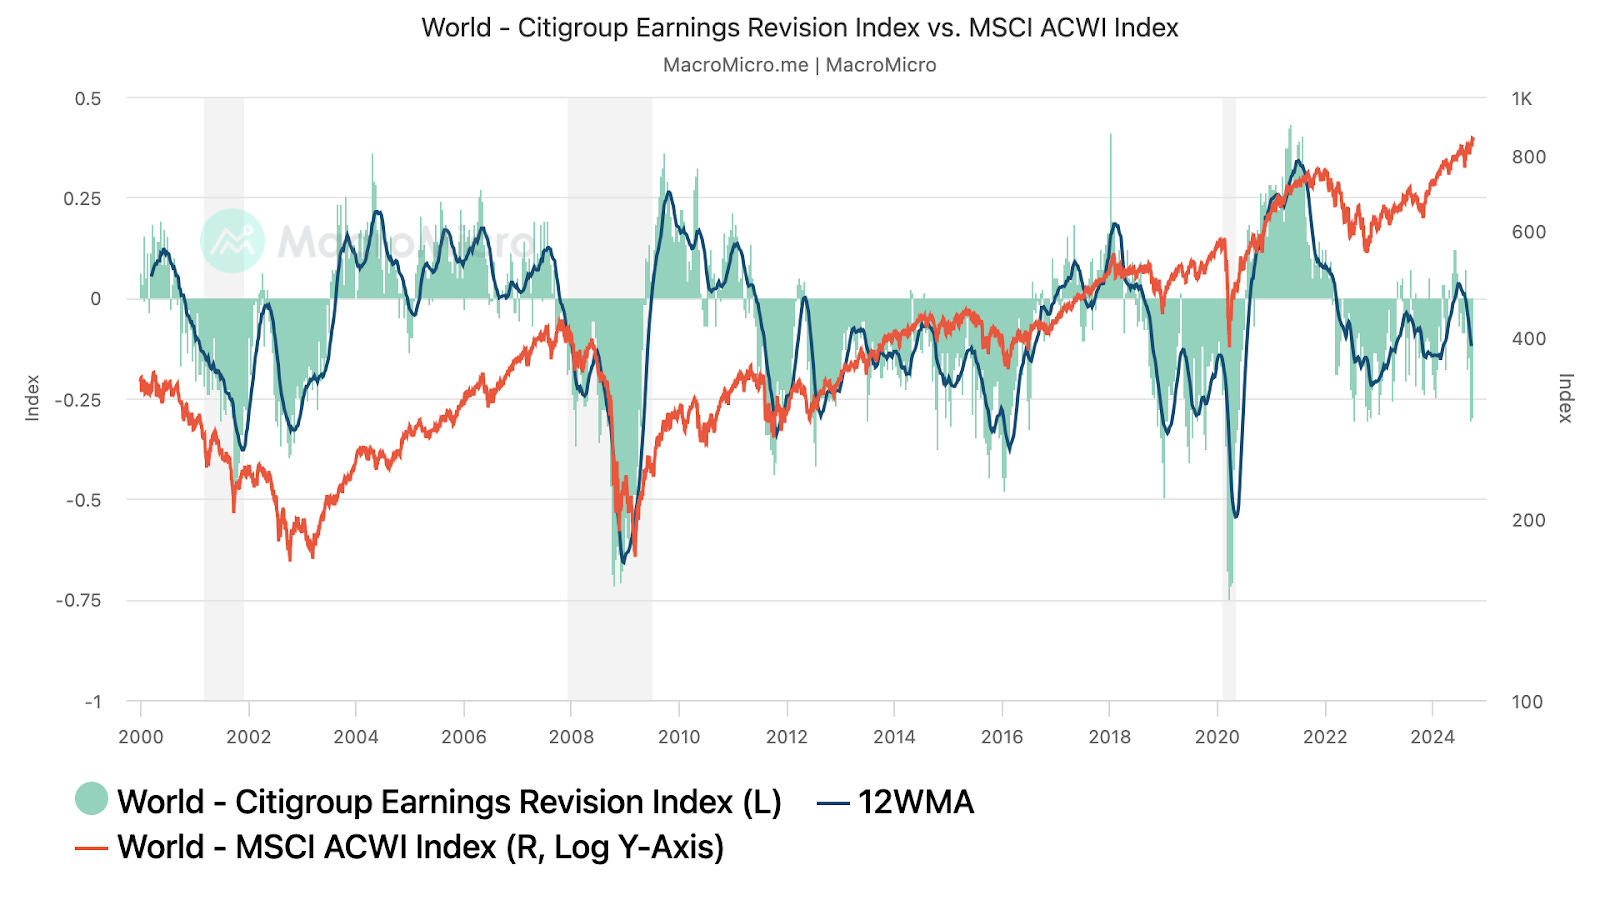
The Citigroup Earnings Revision Index measures changes in corporate earnings expectations. It’s calculated by subtracting the percentage of companies with EPS (earnings per share) downgrades from those with EPS upgrades, compared to the previous week. A value above zero indicates that analysts are generally optimistic about corporate earnings, which can provide positive momentum for stock prices.
Conversely, a value below zero reflects growing pessimism, potentially signalling weaker stock market performance ahead. This index serves as a barometer for market sentiment based on earnings outlooks.
The Citigroup Earnings Revision Index has historically identified turning points in global corporate profits, as seen during the 2018-2019 trade war and the latter half of 2021.
Credit Spreads

A pretty straightforward one.
The credit spread provides insight into corporate default risks by measuring the difference in yields between corporate bonds and risk-free government bonds like the US 10-Year Treasury.
High-yield bonds, also known as "junk bonds," are issued by companies with lower credit ratings. These bonds offer higher yields due to the greater risk of default. For example, the US CCC Credit Spread is the difference between the Merrill Lynch CCC-grade High-Yield Bond Yield and the US 10-year Bond Yield, which acts as the benchmark for the risk-free rate.
When companies are financially stable, their bonds have lower yields since the risk of default is low. In times of financial uncertainty or stress, however, these risks rise. As a result, bond prices drop, yields increase, and credit spreads widen.
The credit spread has a negative correlation with the stock market. As the spread widens, signalling increasing default risks and financial stress, stock prices are likely to fall. Conversely, narrowing spreads typically indicate better economic conditions, which can boost stock prices.
So far, we have covered 4 very useful indicators that can help us preempt a downturn in markets.
In the next section, we will cover 6 more indicators which will help us complete our Macro Matrix, which I will update weekly.
I have concentrated this information into a more digestible Excel sheet like I have done with our portfolios and trades.
We have also assigned each indicator a 1-10 recession score and added our Pragmatic Investor take. You can gain access to the Macro Matrix by subscribing below for just under 60 cents per day.
Alternatively, you can learn more about these great charts I have laid out above at MacroMicro. This site has become my go-to when it comes to accessing the latest macro data, and their blog is also filled with great insights.
I like the site so much that I even reached out to them to become a partner, even though they don’t offer affiliate programmes.
This has allowed me to secure this exclusive discount for my readers. They also have a 7-day free trial so that you can try it at no cost.
And now, let’s complete our Macro Matrix.
Keep reading with a 7-day free trial
Subscribe to The Pragmatic Investor to keep reading this post and get 7 days of free access to the full post archives.