

Alright, we haven’t done one of these in quite a while.
Just last week, we highlighted the perils of the AI bubble
A well-received piece, which covered the fundamental reasons why the AI trade could begin to unwind.
Key work being could here, and for those that know what I own, I still am long various AI names, though I did take profits last week.
Now, in the two days we have seen:
Nasdaq break its 9-day winning streak
Bitcoin break below $64K
Broadcom (AVGO), bear earnings and crash 15%
So, today we’re going to be looking at various charts, stocks, and indexes to identify where we are in terms of the technical outlook.
Let’s begin with the Semis:
SOX
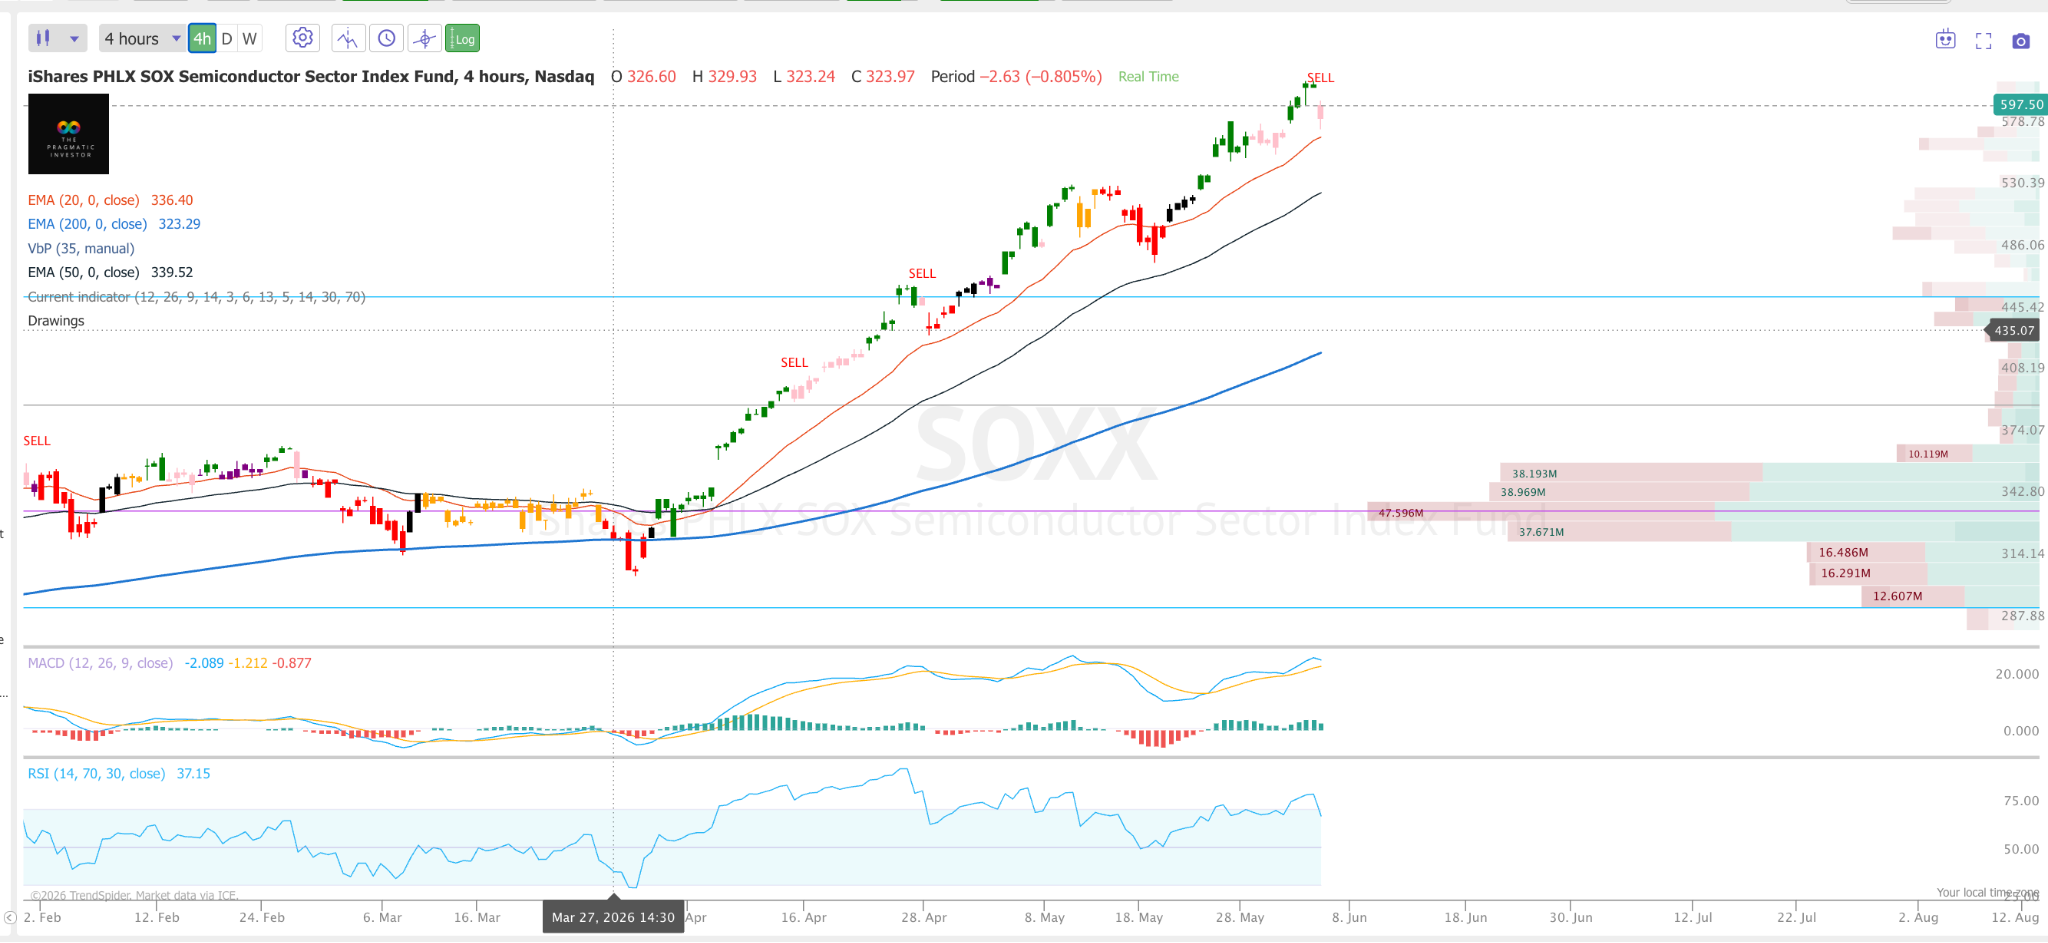
We’ve seen semis take a breather and lead the market down in the last couple of days.
Now, I’ve zoomed into the 4h chart here, and we’re also applying our recently developed Buy/Sell Indicator, which did trigger a Sell signal near the top.
However, note these signals are unreliable in the shorter time frames.
Technically here, we still have quite a bit of strength. Holding over the 20 EMA, positive MACD and RSI are still trending up.
EWY
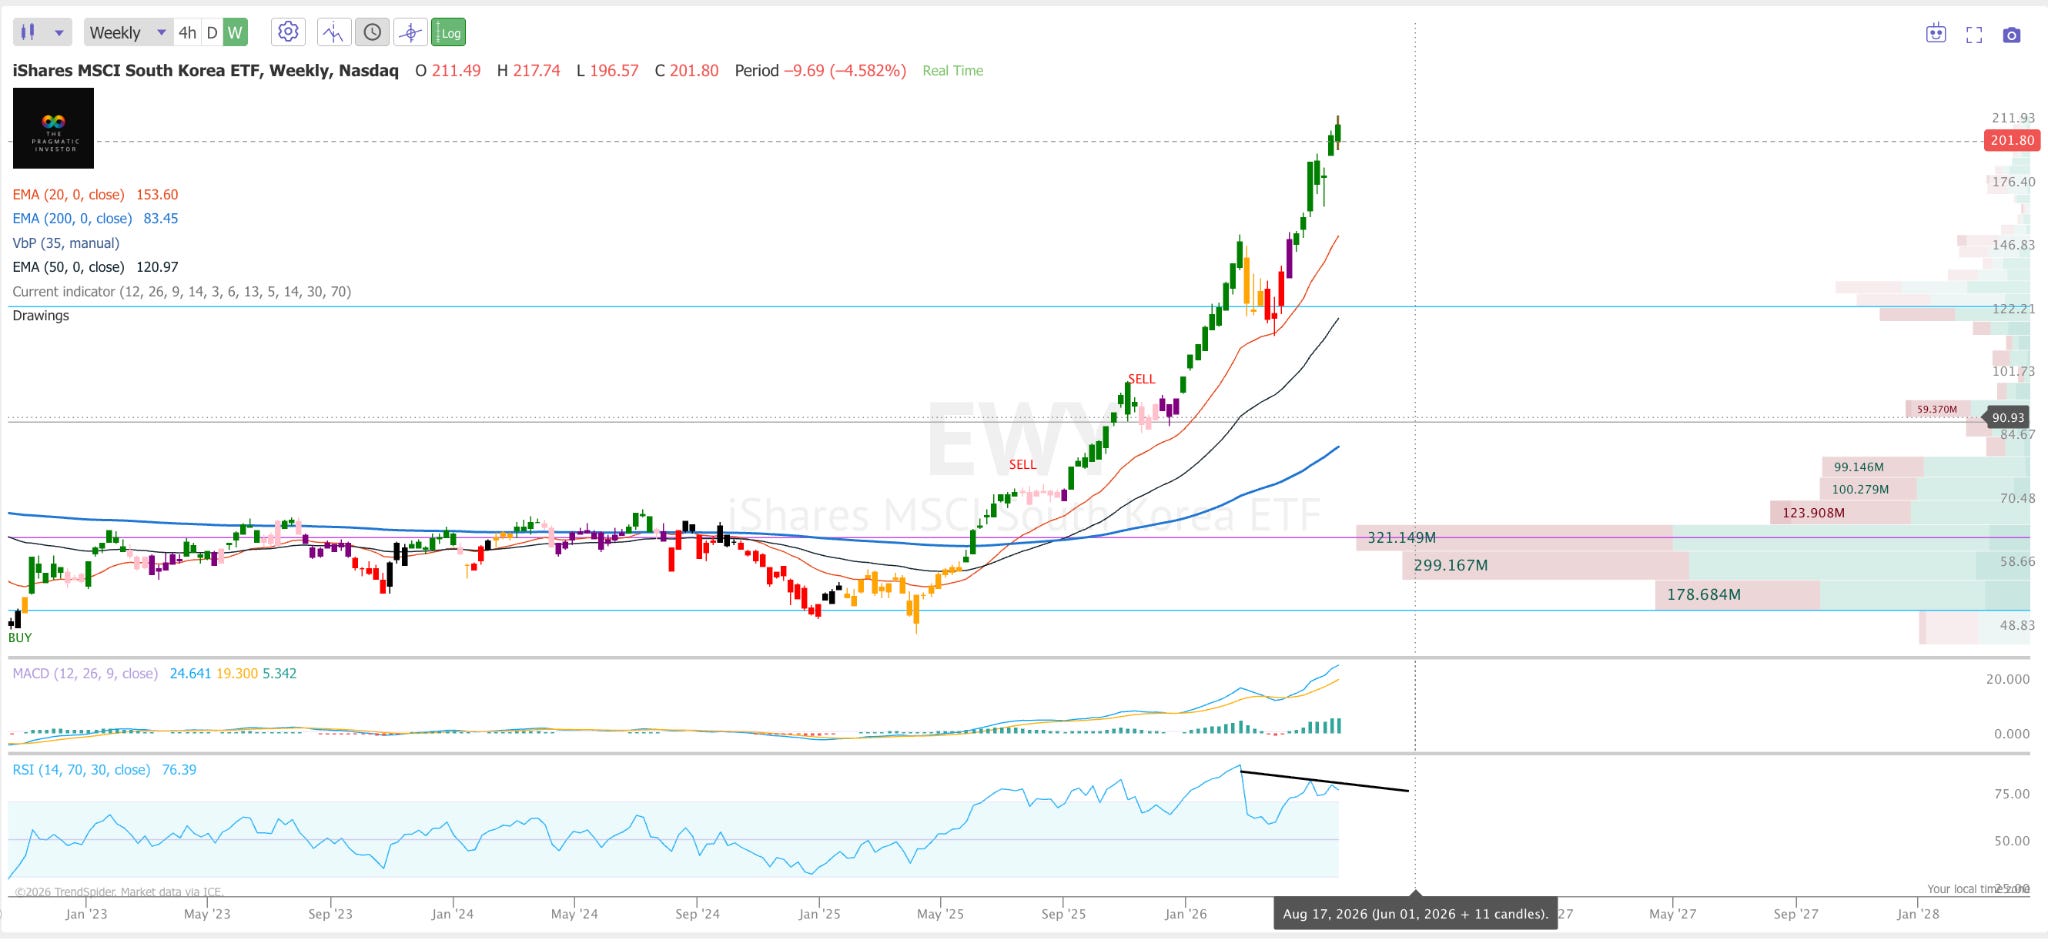
Can’t talk about AI and semis without talking about South Korea.
This ETF has performed insanely well. I don’t have a clear Sell on our indicator yet, but we do see momentum waning and a clear RSI divergence on the weekly.
Consider that even a test of the 20-week EMA here would be close to a 20% drop.
NDX
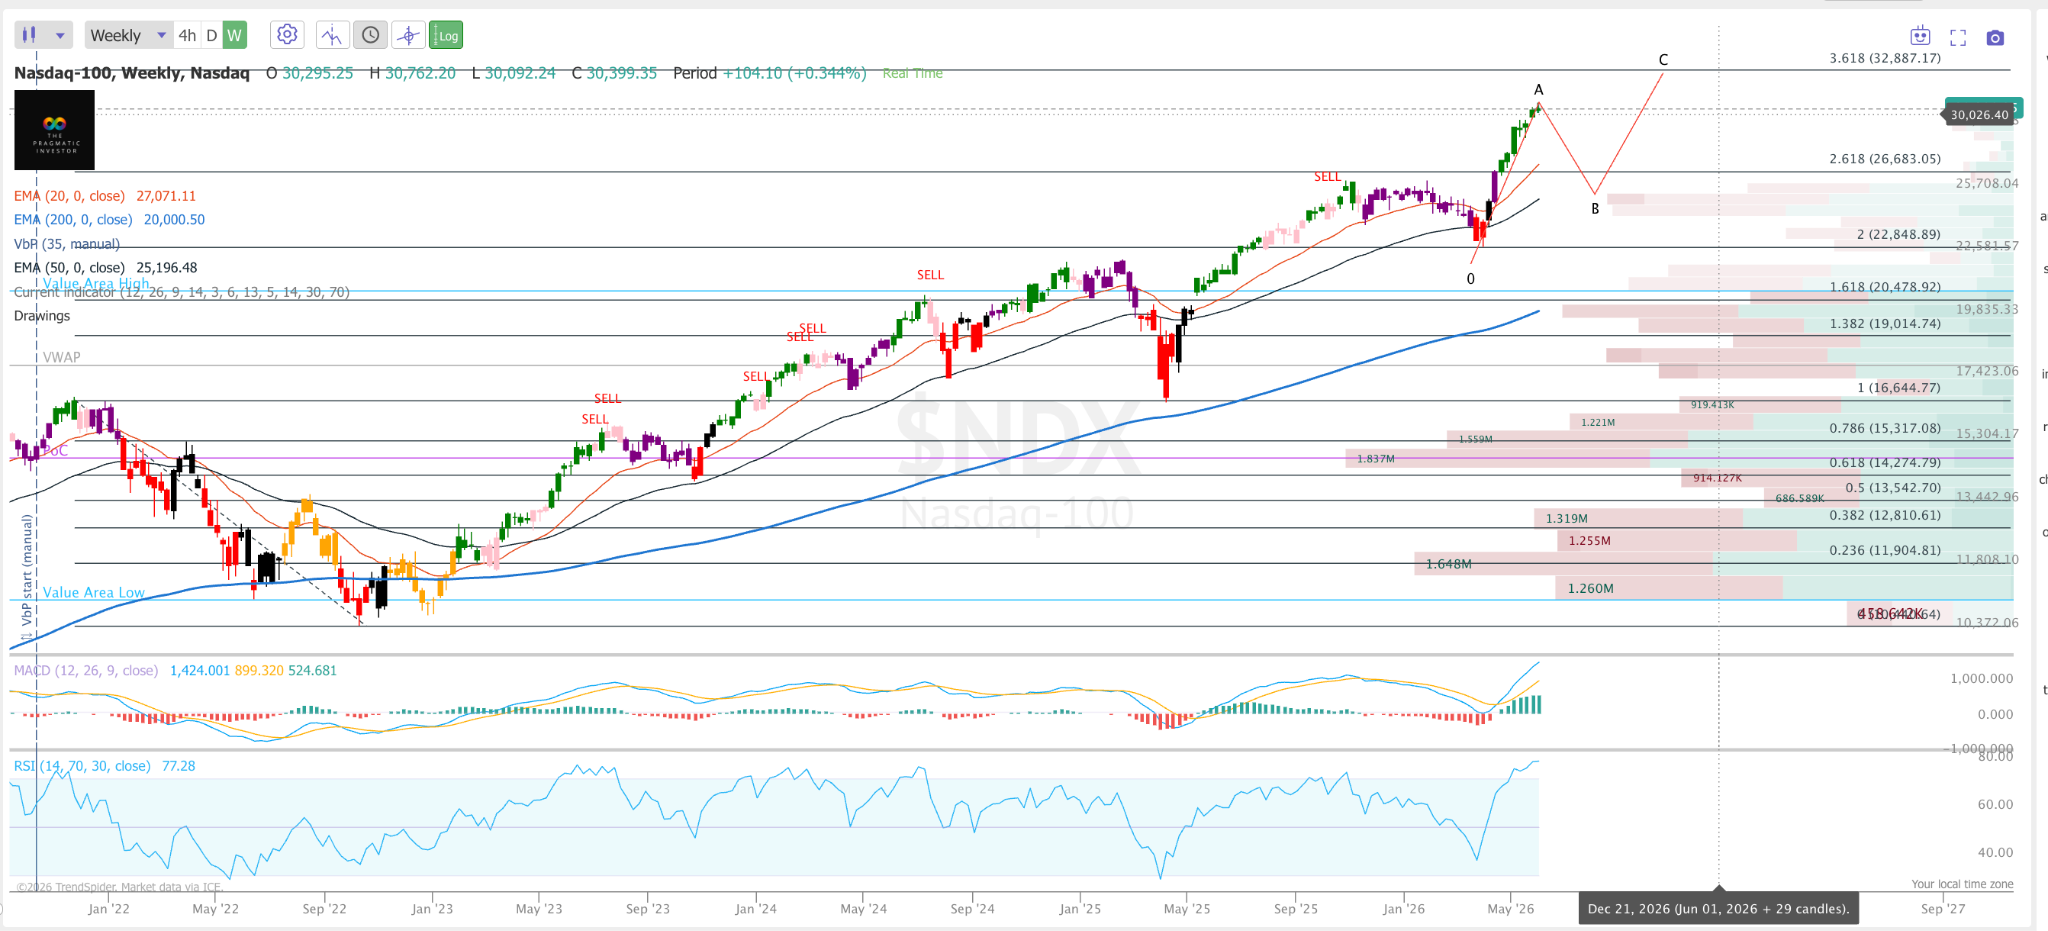
Now, a look at the weekly on the Nasdaq.
As we can see, no Sell triggered here, and not much in terms of weakness yet.
However, the RSI is now at record levels, and this has historically triggered a sell-off here.
I’d love to see the Nasdaq test support at 25,700, where volume comes in before a bounce higher.
SPX
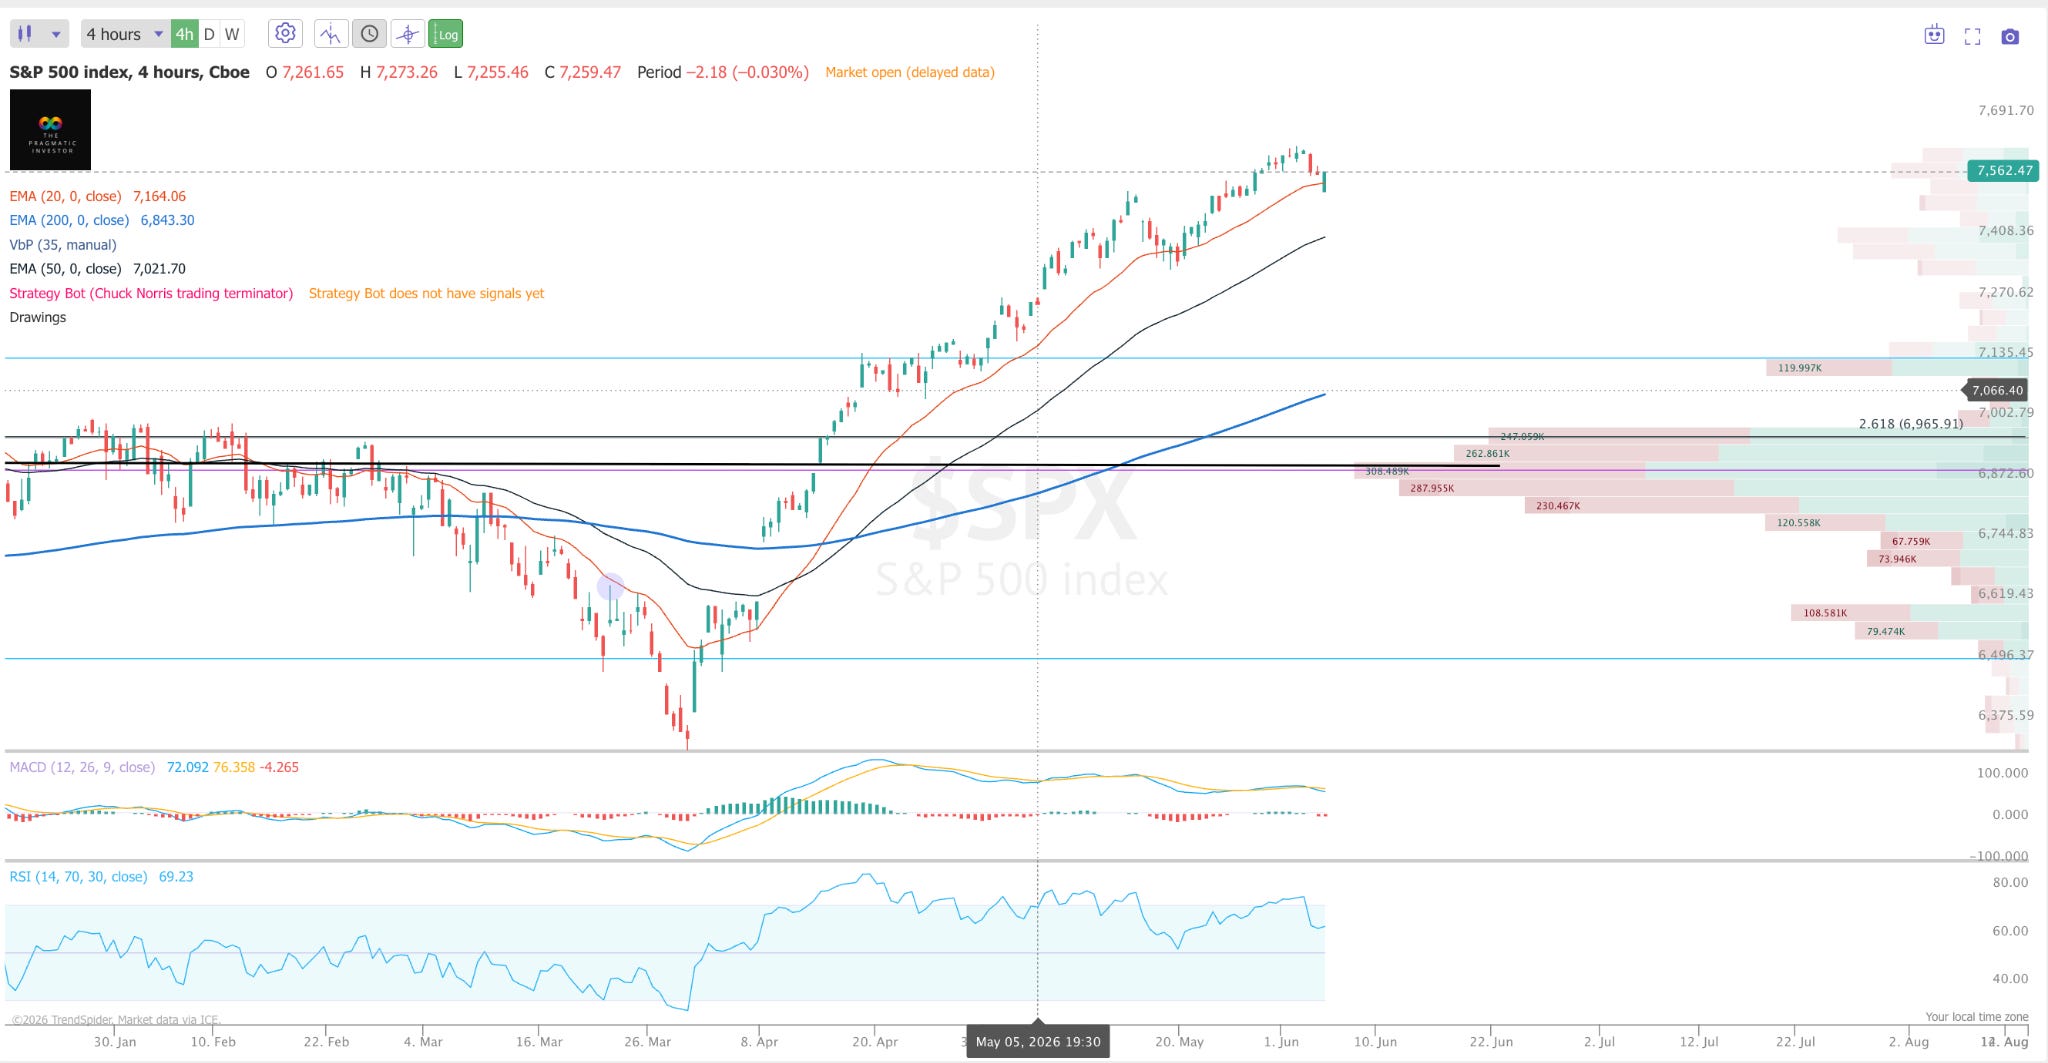
Zooming into the 4h on SPX, we do have a bearish cross and a break of the 20 EMA. This could be the beginning of an unravelling, but again no clear sell signal yet.
BTC
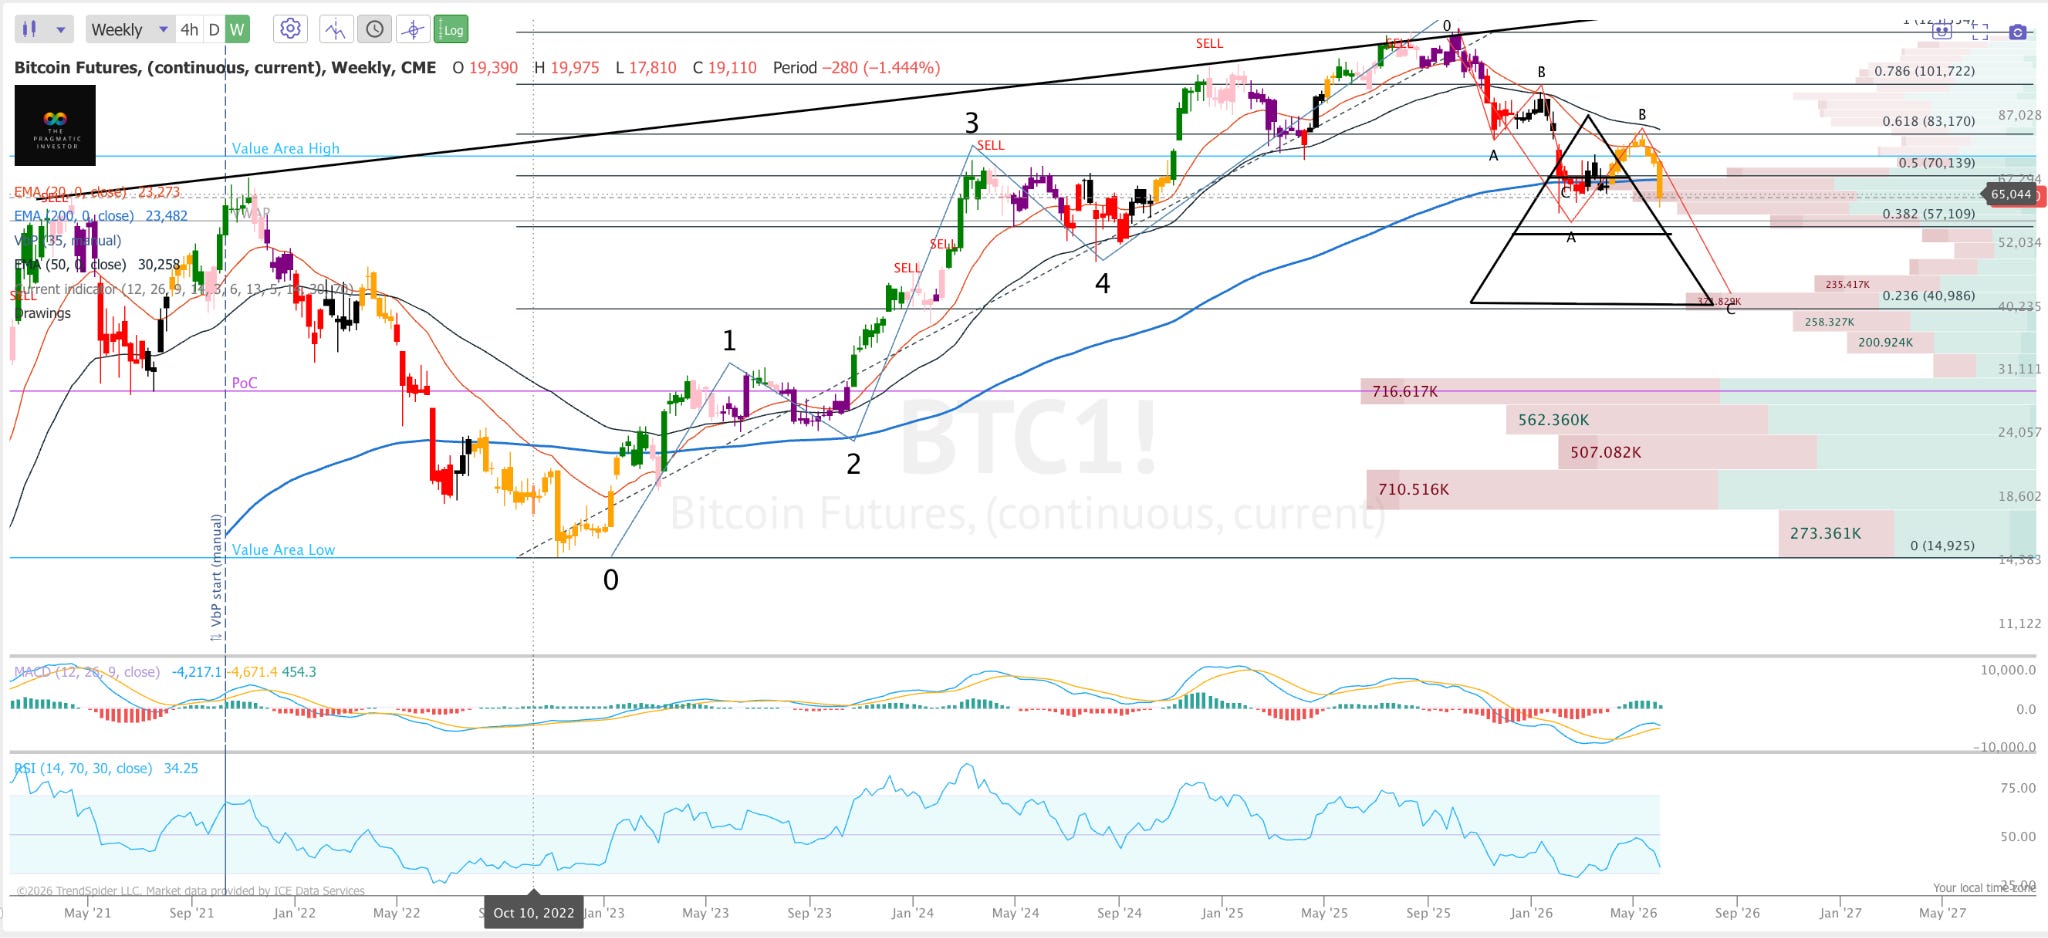
Alright, let’s talk about Bitcoin, the one that got left behind. Everything is showing that we need to test lower levels now.
The set-up here is similar to the 2022 decline. Big fall, B wave bounce, and now another leg lower, which in this case could land is at $40K.
Months ago, I posted a chart with the same triangle highlighting my accumulation strategy here.
20%, 30% and then 50% as we approach the lower tranche. at $40K.
ETH
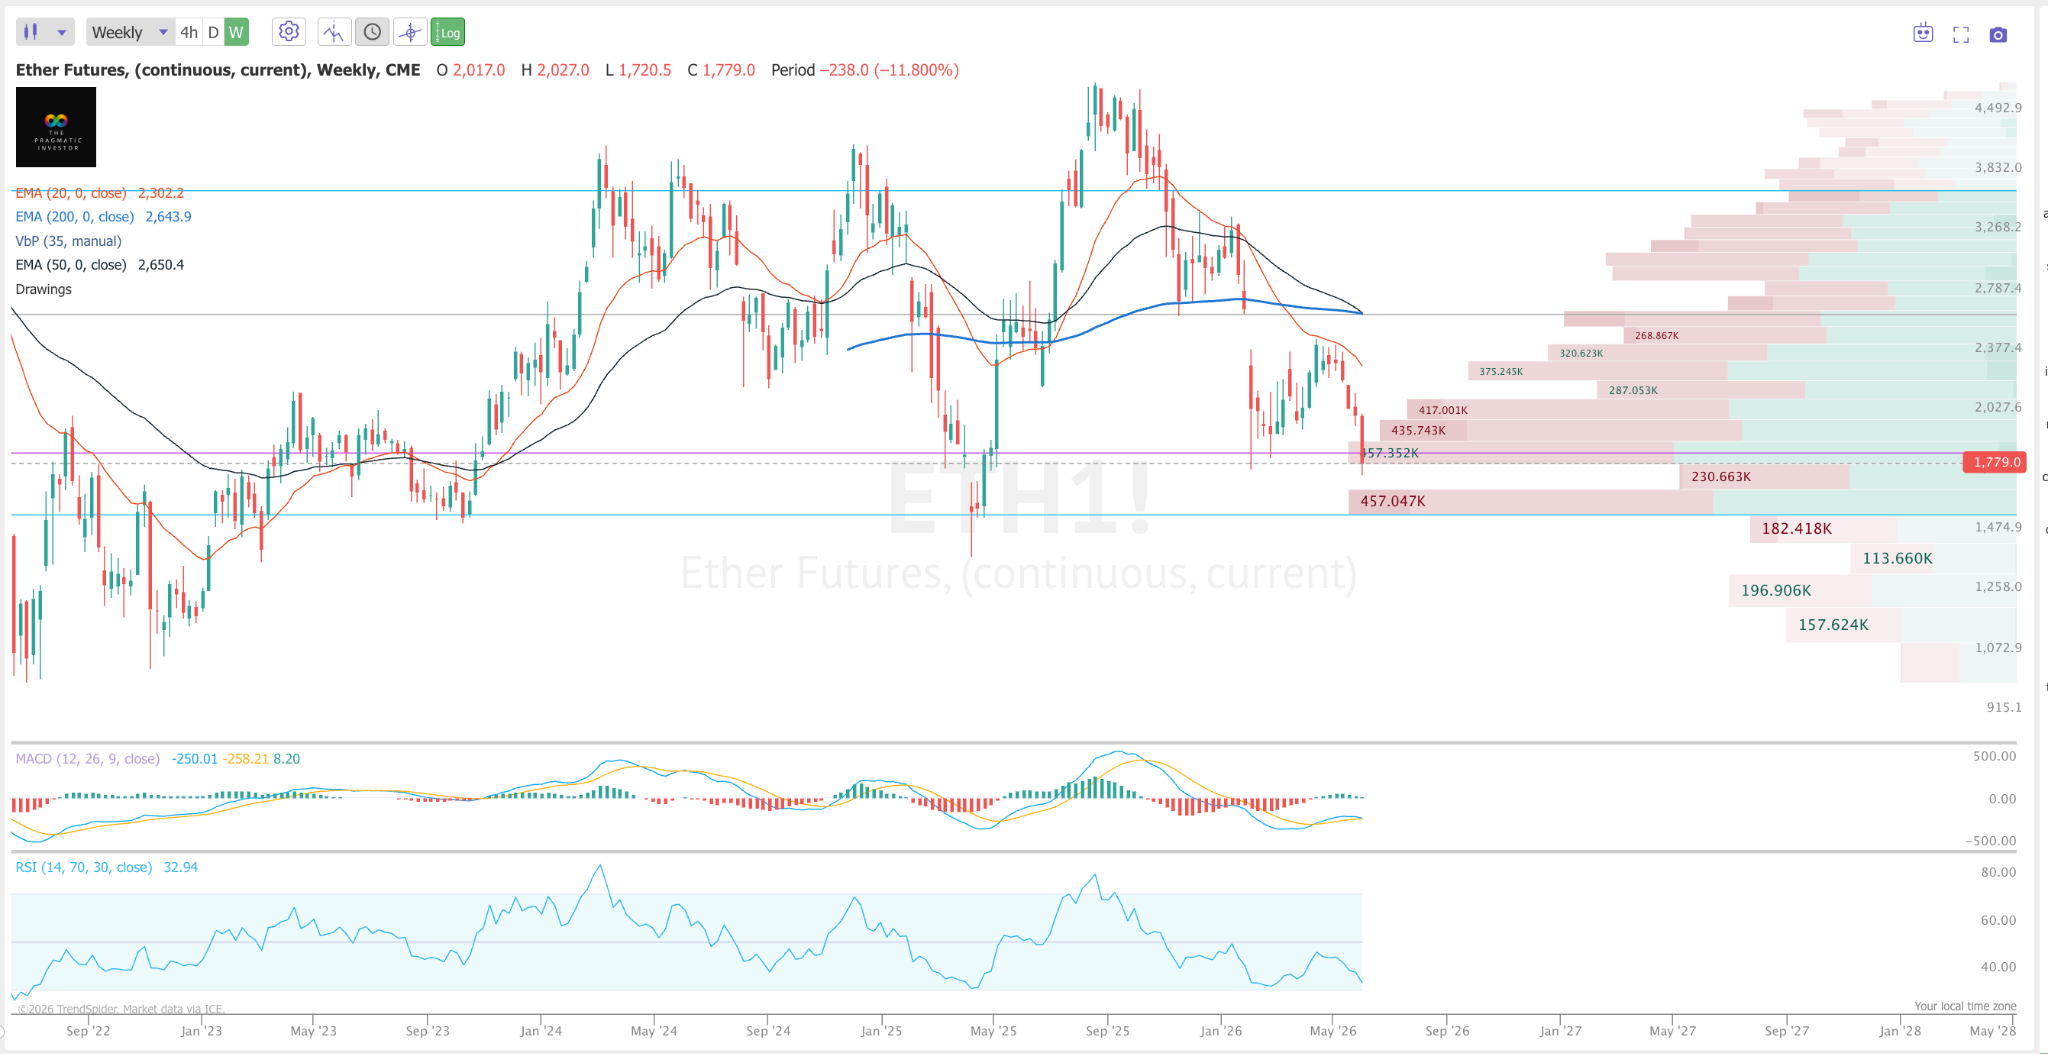
And how about Ethereum?
Honestly, it feels like no one, including myself, is talking about this, and perhaps that’s a signal to buy.
But from a technical perspective, we’re getting ready to break lower lows as the MACD flips bearishly.
Like with BTC, I’d say not a bad place to have an allocation, but definitely leave some dry powder in case we reach $1000.
GLD
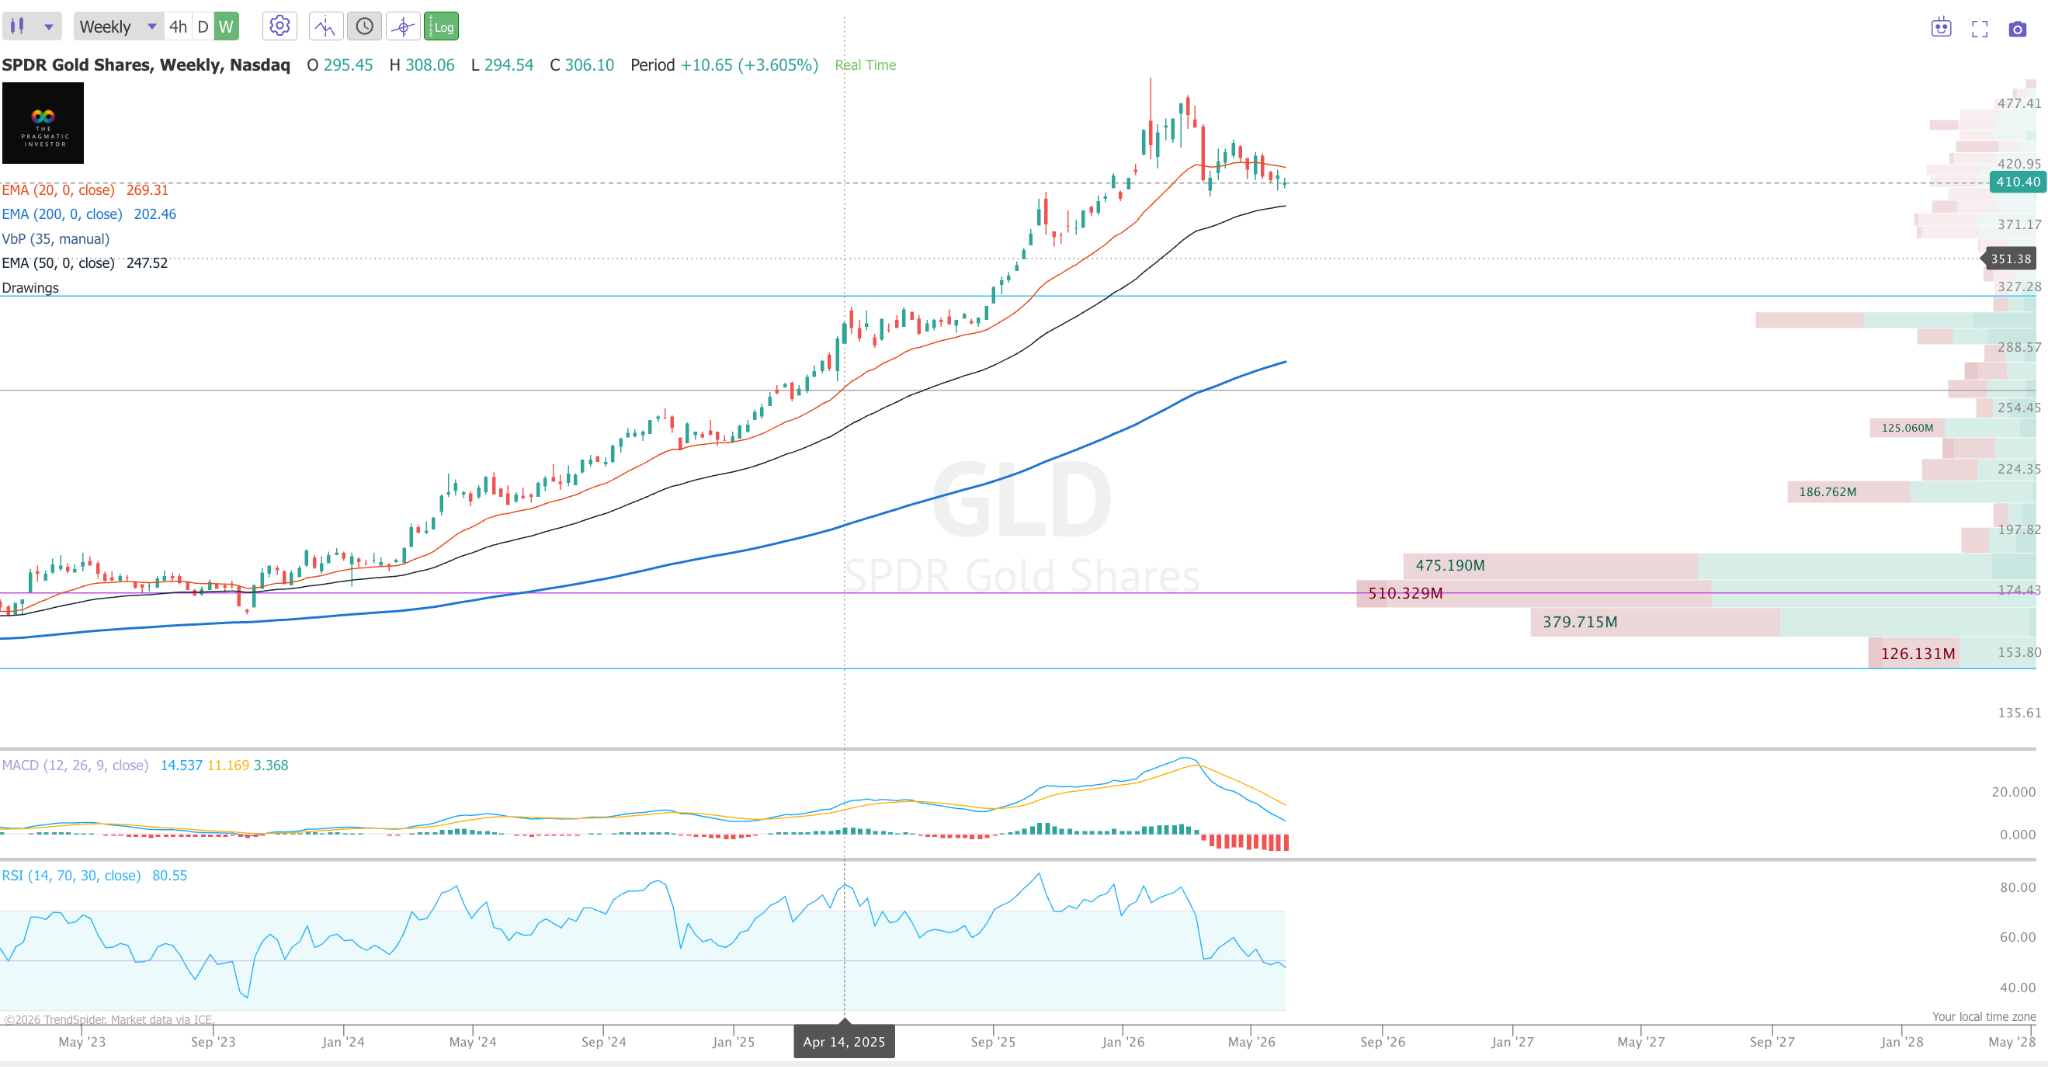
Gold has also been awfully quiet in the last few weeks.
The Iran war triggered some selling for sure, but I’m still quite bullish long-term.
Testing the 50 EMA soon, but if that breaks we could cascade down to support at 290 on GLD.
Gold likes these long accumulation phases, but eventually it will explode higher IMO.
Now, let’s look at some stocks.
NBIS
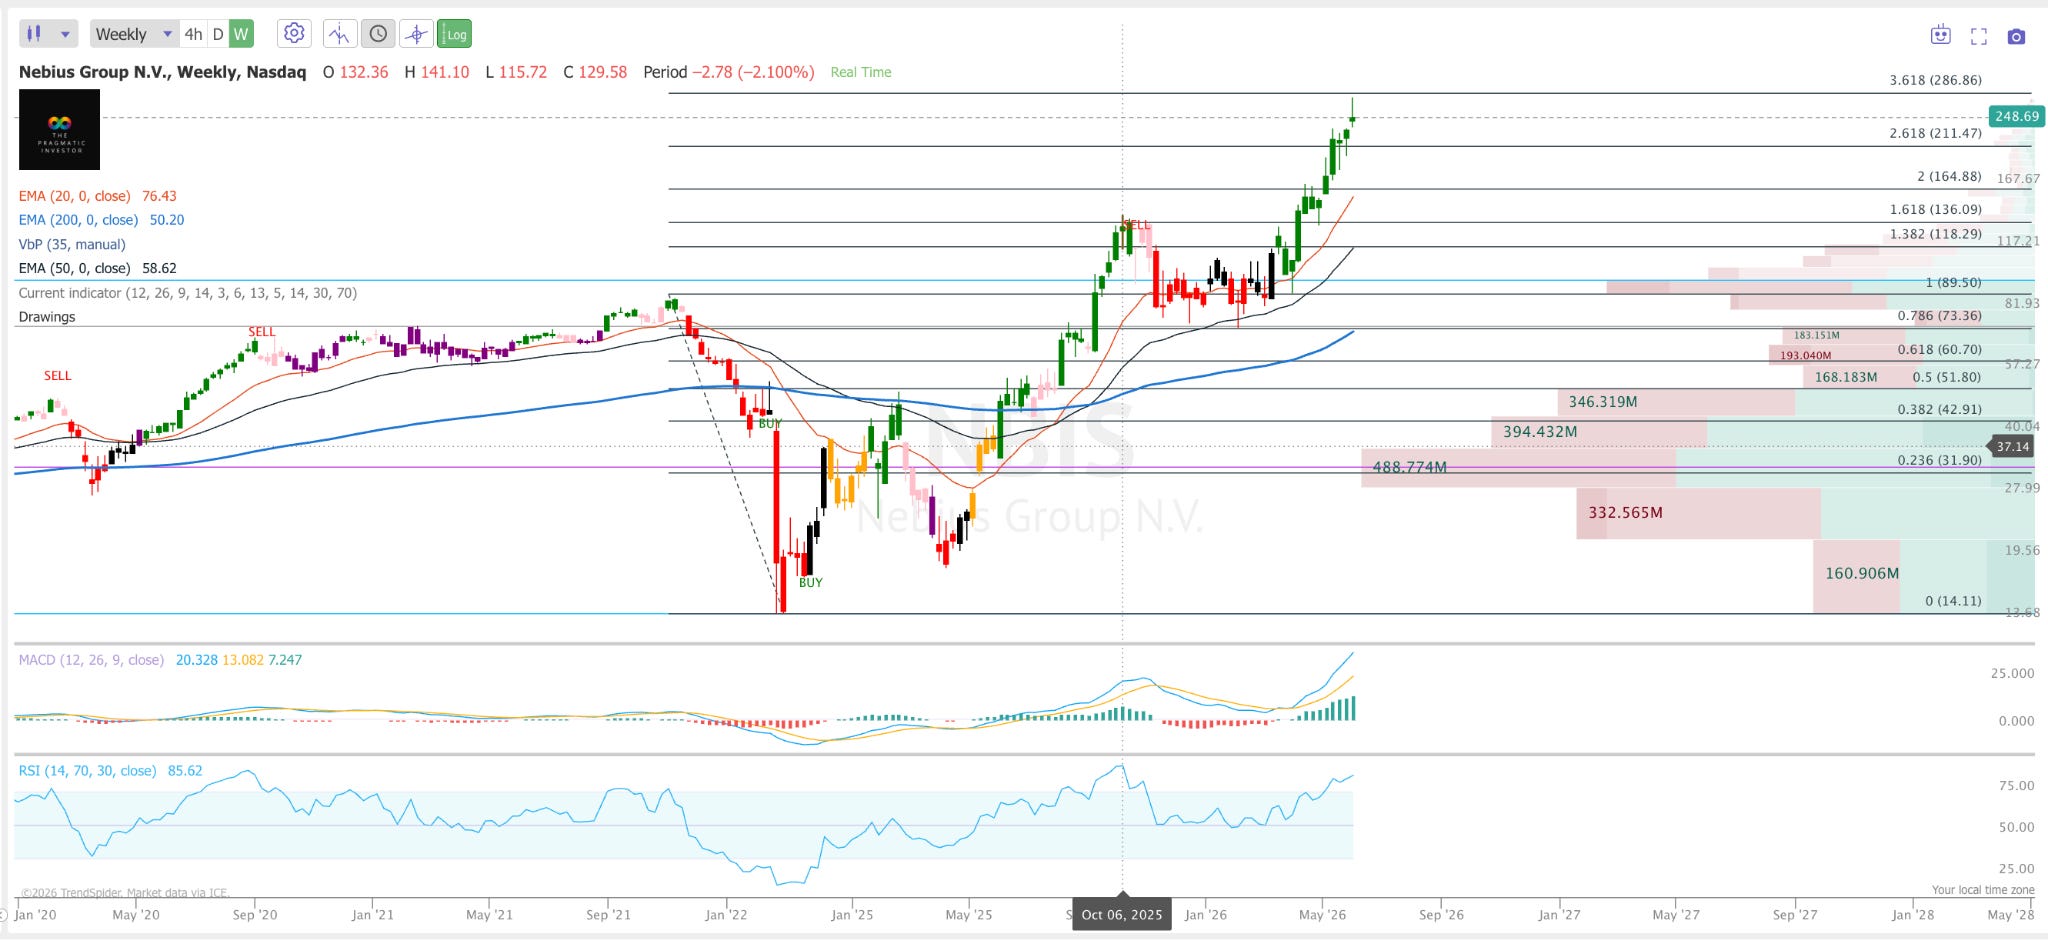
Nebius has been unstoppable, but we’re getting quite overbought on the weekly. I’d love to see this retest at least the 20 EMA.
AVGO
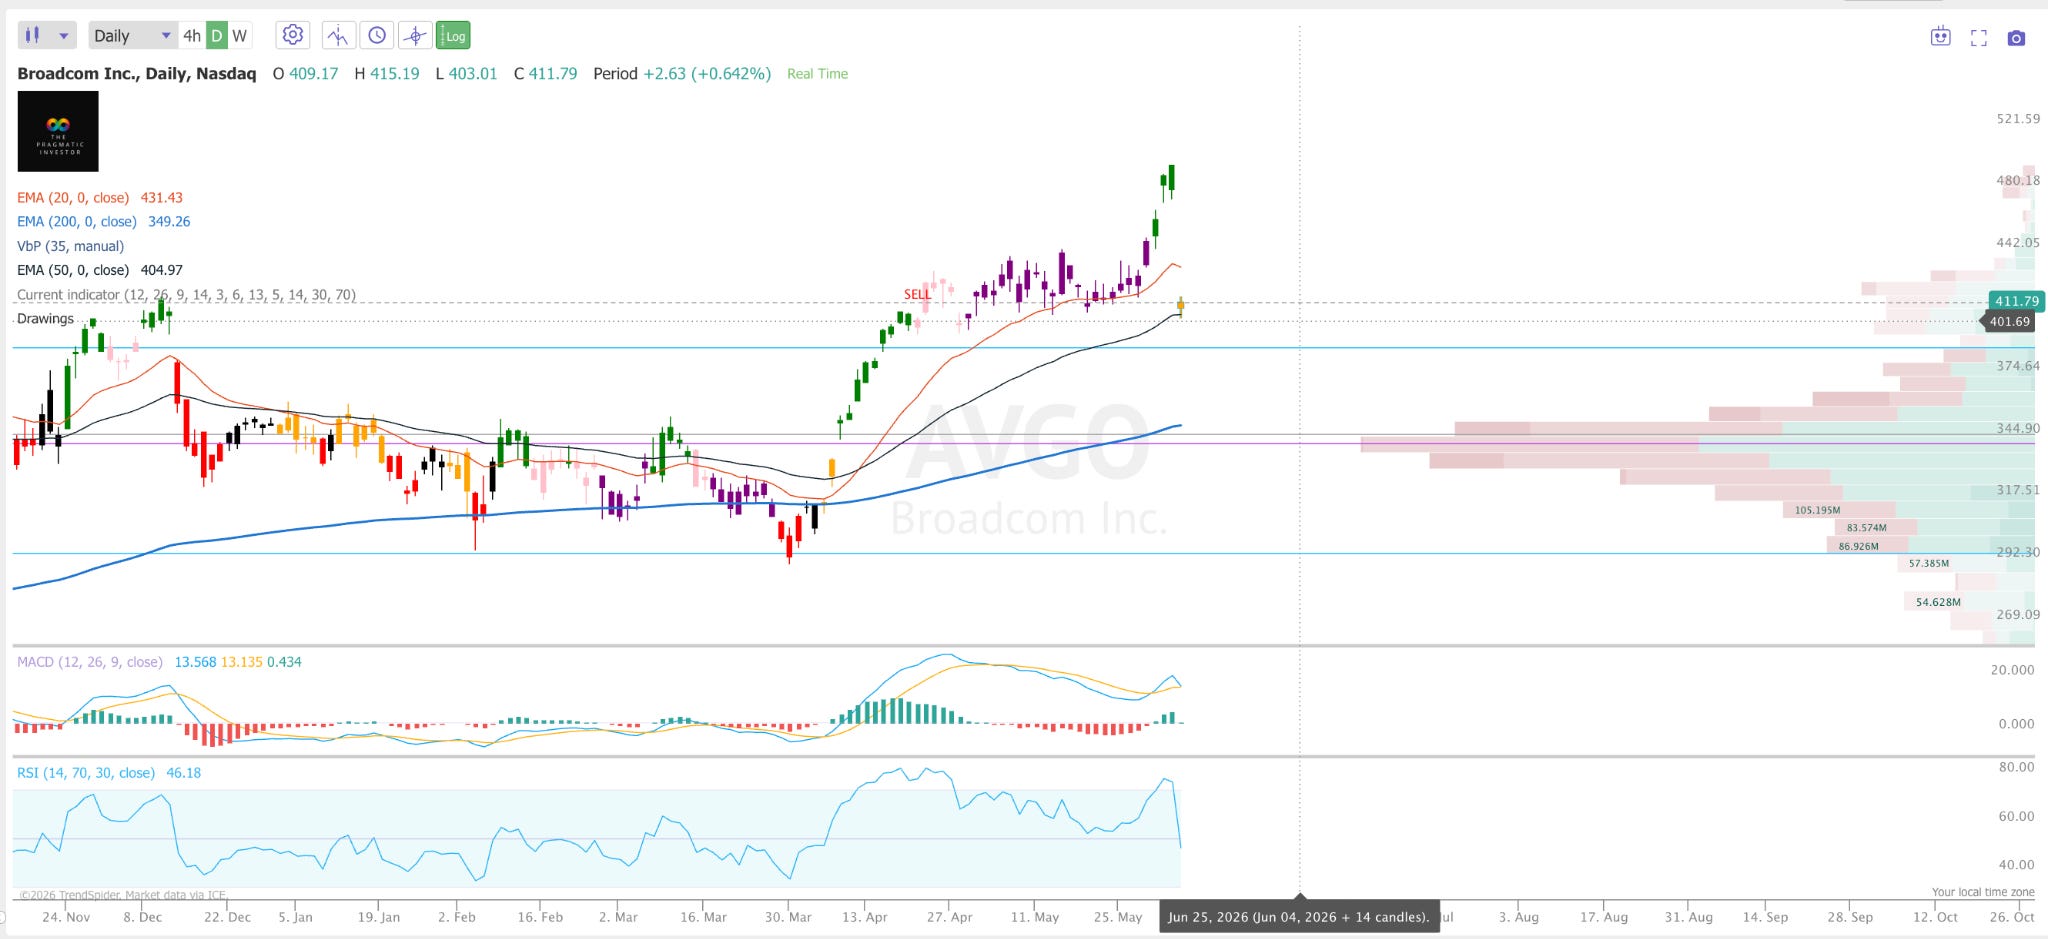
Bouncing here at the key $410 level. If we break below $400, then this could confirm the top is in, and we could quickly be back to $300.
AMD
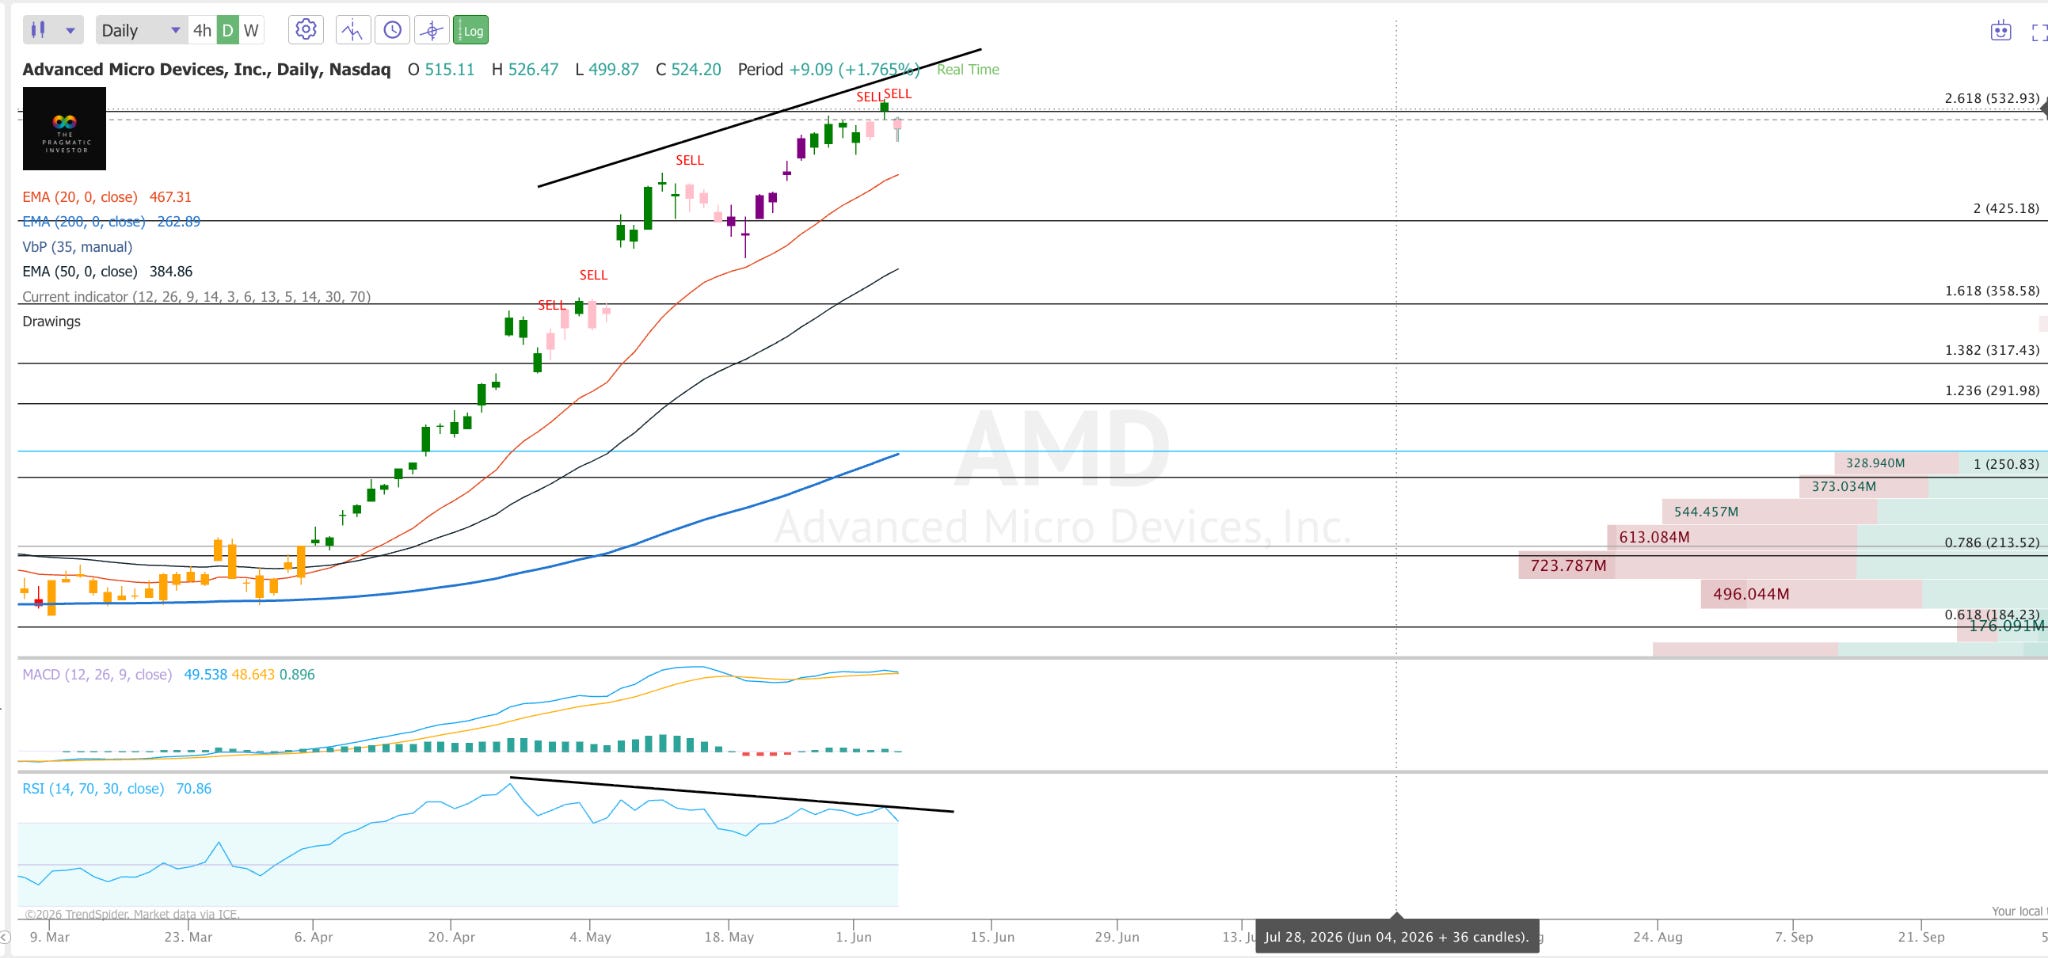
A stock I have always loved, but the poster child for a retracement. Very big RSI divergence, MACD wanting to flip, and two Sell Signals in the last week.
AMD needs to take a breather.
The Chart That Could Derail Everything
Now, to wrap up, I’d like to highlight the most important chart I am tracking right now.
A chart that could essentially derail the whole AI rally, crypto market, and destroy everything from commodities to emerging markets.
