My Trading System And (Market Beating) Algorithm
How I Built A Market Beating Algorithm
Overview
It’s time to talk about trading strategy and systems.
When it comes to trading, there are thousands of different assets you can invest in, and also thousands of different strategies you can use.
Lots of strategies can work. It’s simply a matter of using a system that works for you, and applying it consistently.
When it comes to my trading approach, there’s one simple truth I have learned the hard way, which guides me in every decision I make.
Less Is More
Just because you have hundreds of indicators available at your disposal, doesn’t mean you have to use them, and it certainly doesn’t mean that you will have more success by using more.
TechnicalIndicators, while incredibly useful, aren’t perfect, they contradict each other, and they can ultimately bury the “truth” under a mountain of noise.
That’s why I use 3-4 true and tested indicators to build my strategy, and, more recently, my algorithm, which can take all the emotion and guesswork out of trading.
In this article, we will go through:
What Technical Analysis, TA, is and isn’t
My 3 favorite indicators
How I Built My Algorithm on TrendSpider
How I use TA as part of my holistic investment approach
Technical Analysis 101: Does It Really Work?
Technical analysis is the practice of predicting future price movements in financial markets by analyzing historical price and volume data. It operates on the belief that price movements follow trends and that history often repeats itself, making it possible to forecast market behavior by studying past patterns.
The Basics: Charts, Indicators, and Patterns
Technical analysis relies heavily on three key tools: charts, indicators, and patterns.
Charts graphically represent a stock's price movement over time. The most common types of charts include line charts, bar charts, and candlestick charts, each offering unique visualizations of price trends. These charts are fundamental for identifying potential price movements and serve as the backbone of technical analysis.
Indicators are mathematical calculations applied to price, volume, or open interest data, providing insights into market momentum, trend strength, and potential reversals. Popular indicators include Moving Averages, which smooth out price data to identify trends; the Relative Strength Index (RSI), which measures the speed and change of price movements; and the Moving Average Convergence Divergence (MACD), which helps spot changes in the strength, direction, momentum, and duration of a trend.
Patterns are formations created by the price movements on charts. Recognizing these patterns, such as ‘Head and Shoulders’ or ‘Double Top,’ can provide traders with clues about future price directions. These patterns are based on historical price behaviors that tend to repeat over time.
The Underlying Philosophy
The core philosophy of technical analysis is that the current price reflects all necessary information, whether it's related to public news, company financials, or broader economic factors. This principle allows technical analysts to focus less on the "why" and more on the "what" – specifically, what the price patterns and trends suggest will happen next. The idea is that the market's collective knowledge is distilled into the price, making it a reliable indicator of future movements.
Does Technical Analysis Work?
The effectiveness of technical analysis is often questioned, especially by those new to trading or investing. The simple answer is yes, it can work, but its success largely depends on the skill of the user. Technical analysis is a tool that, when used correctly, can help traders anticipate market movements and make informed decisions. However, like any tool, its effectiveness is determined by how well it's applied.
Technical analysis works because it is based on the observation that human behavior in markets tends to be consistent over time. Patterns repeat because market participants often react similarly in comparable situations. Recognizing these patterns early can lead to profitable trading opportunities.
My Favorite Indicators
Now, a look at some true and tested indicators that I use daily.
Moving Averages
Moving averages are a fundamental tool in technical analysis used to smooth out price data and identify trends over time. They work by calculating the average price of a security over a specific number of periods, such as days or weeks.
The two most common types are the simple moving average (SMA), which calculates the average price over a set period, and the exponential moving average (EMA), which gives more weight to recent prices. Moving averages help traders identify potential support and resistance levels and confirm trends.
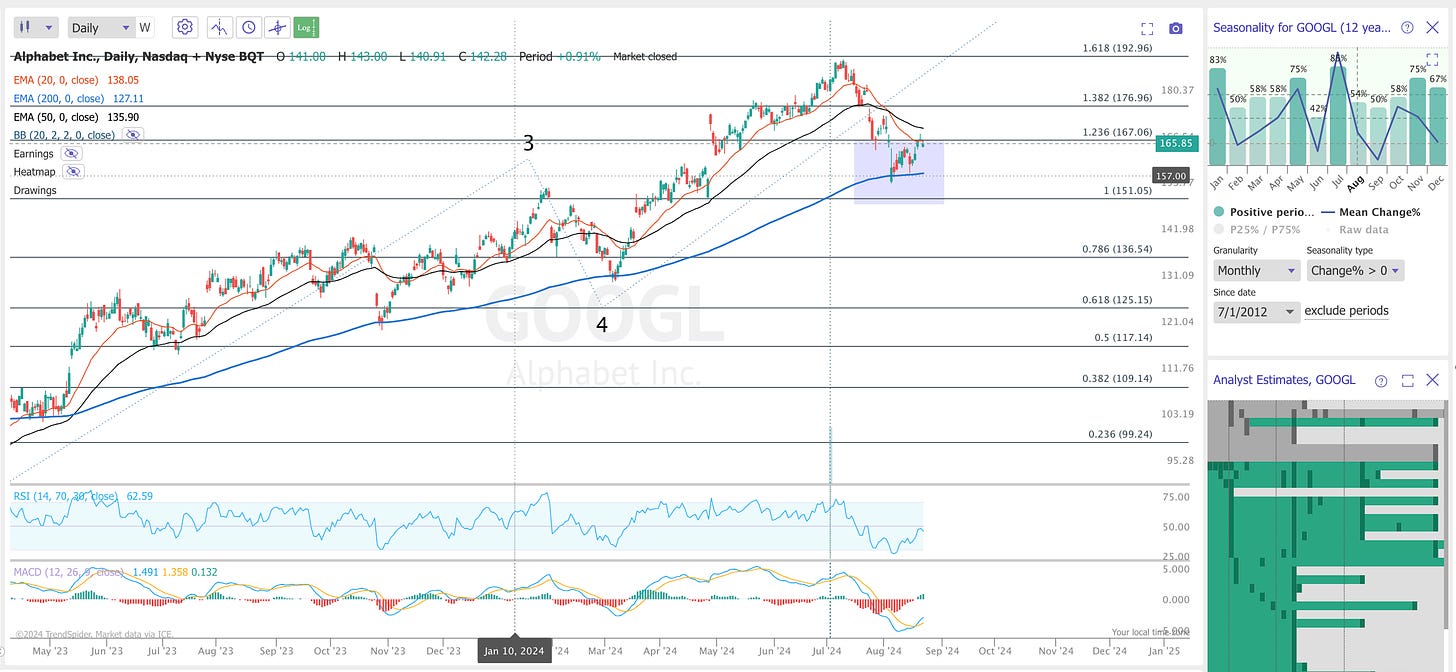
In the chart above we can see how the 200 EMA has acted as strong support for GOOGL over this bull market. It won’t always be respected, but it is definitely a level that a lot of people are watching, which means it's a level YOU should be watching.
Moving Average Convergence Divergence (MACD)
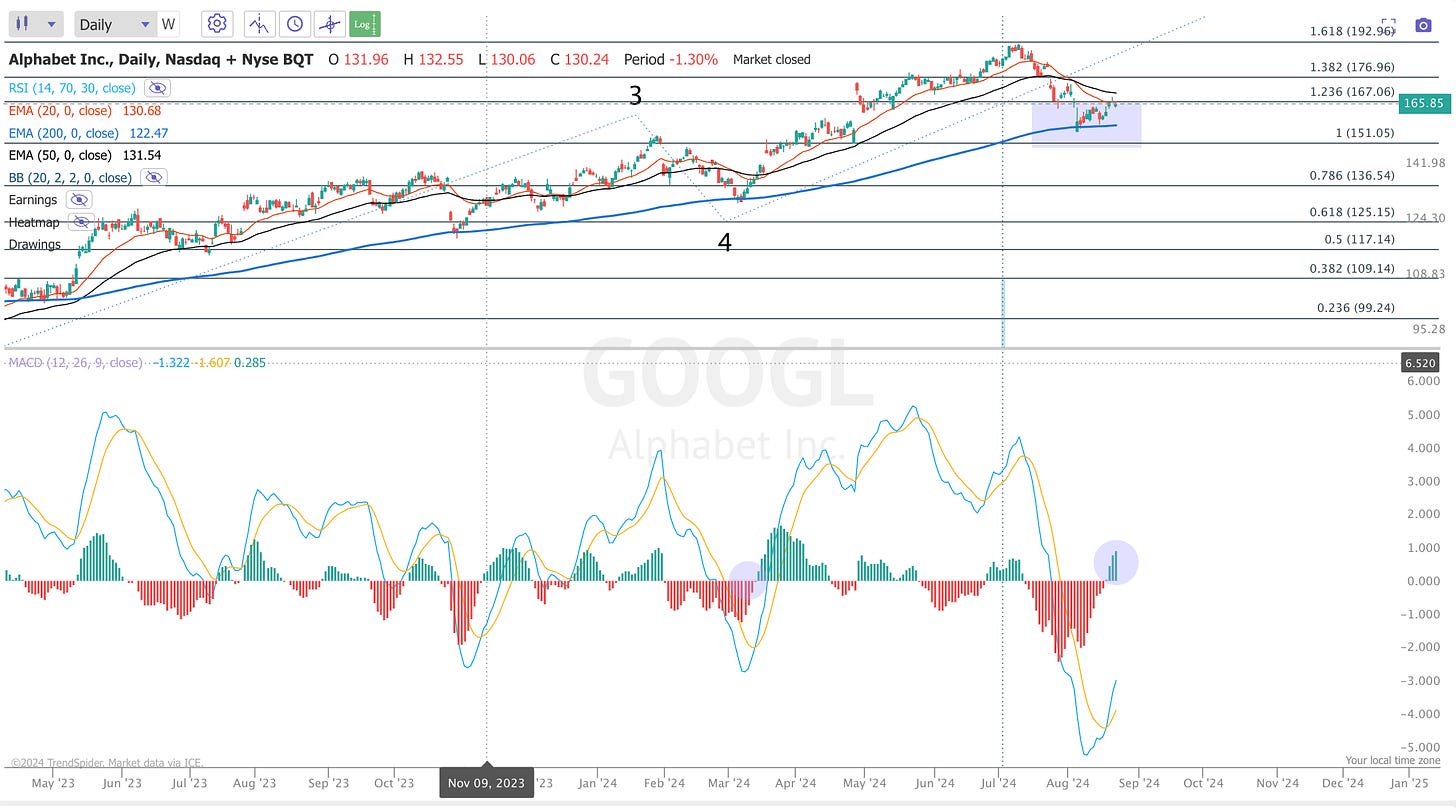
The MACD is used in technical analysis to identify changes in the strength, direction, momentum, and duration of a trend in a stock's price. It consists of two lines: the MACD line, which is the difference between the 12-day and 26-day exponential moving averages (EMAs), and the signal line, which is a 9-day EMA of the MACD line. When the MACD line crosses above the signal line, it suggests a bullish signal, while a cross below indicates a bearish signal.
The MACD histogram shows the difference between the MACD line and the signal line, providing additional insight into the strength of the trend.
MACD is one of the best indicators out there, showing us momentum through the movement of different MAs. One of the simplest strategies one can apply here is to look at bullish/bearish MACD crossovers, which is when the signal and MACD line cross over.
Relative Strength Index (RSI)
The Relative Strength Index (RSI) is a momentum oscillator used in technical analysis to measure the speed and change of price movements. It ranges from 0 to 100 and helps determine whether a stock is overbought or oversold.
An RSI above 70 typically indicates that a stock is overbought and may be due for a pullback, while an RSI below 30 suggests that it is oversold and could be poised for a bounce. RSI is valuable for identifying potential reversal points in a stock's price trend.
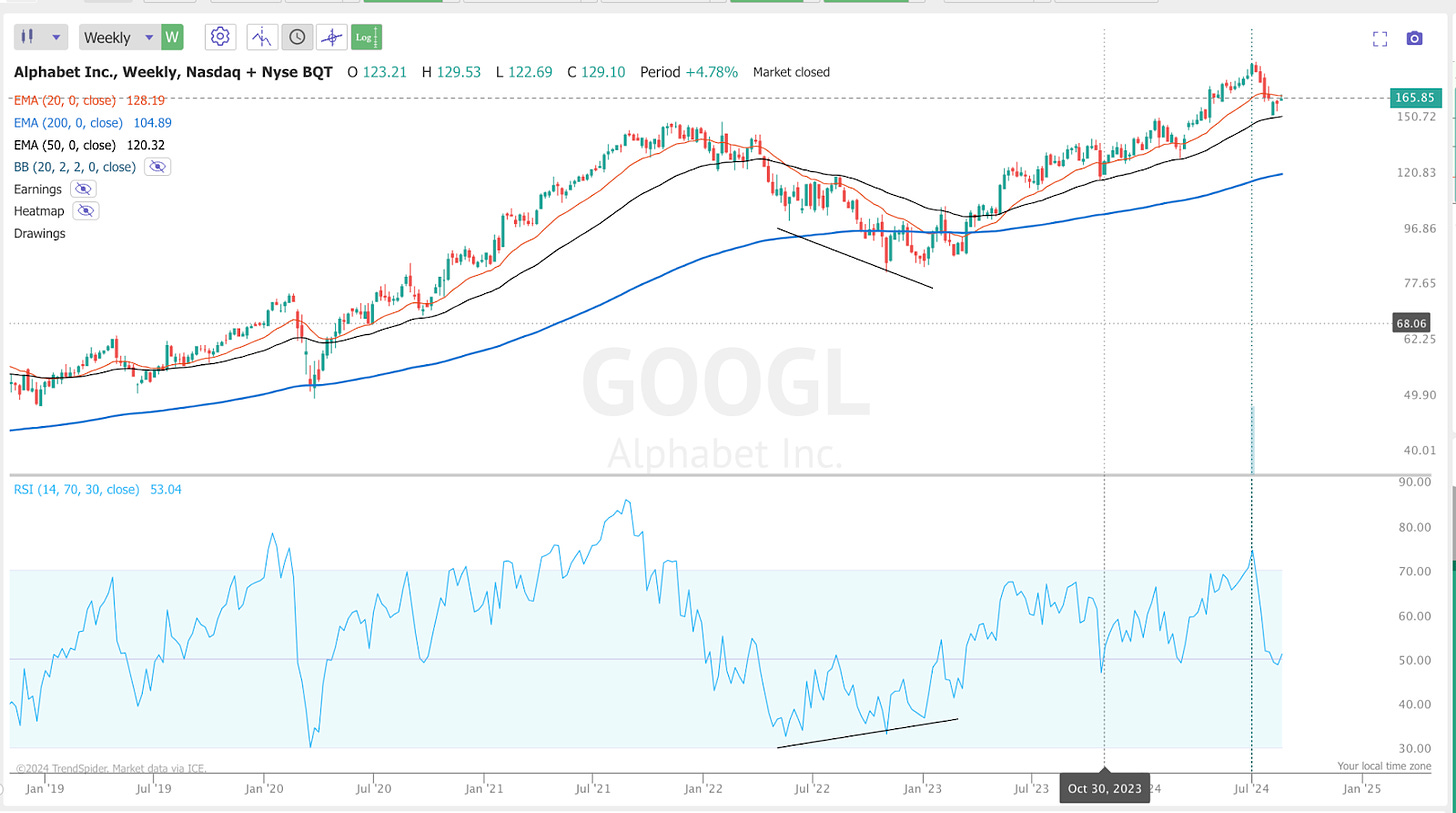
Another great indicator. If you have a stock you like, like Alphabet, then a very simple strategy could be selling when it reaches an oversold level on a long time frame like the weekly.
Something I love doing with the RSI is spotting divergences. We can see this happened as the stock bottomed in 2022. The RSI made a low back in June, and then proceeded to climb higher, while the price went lower. This divergence was showing a hidden strength in the stock.
Fib extensions, retracements and Elliott Wave
Fibonacci retracements and extensions are tools used in technical analysis to identify potential support and resistance levels. Retracements are horizontal lines indicating where price might pull back before continuing in the direction of the trend, commonly at the 38.2%, 50%, and 61.8% levels.
Extensions project potential areas of support or resistance beyond the current price level, often used to identify take-profit points. These levels are based on the Fibonacci sequence, which is observed in natural patterns, providing traders with insights into market psychology and behavior.
Elliott Wave Theory is a method of technical analysis that predicts market trends by identifying recurring wave patterns. It is based on the idea that financial markets move in repetitive cycles or "waves," which are influenced by the psychology of traders.
The theory categorizes these waves into five upward (impulsive) waves followed by three downward (corrective) waves in a complete cycle. By analyzing these wave patterns, traders aim to forecast future price movements and identify potential turning points in the market.
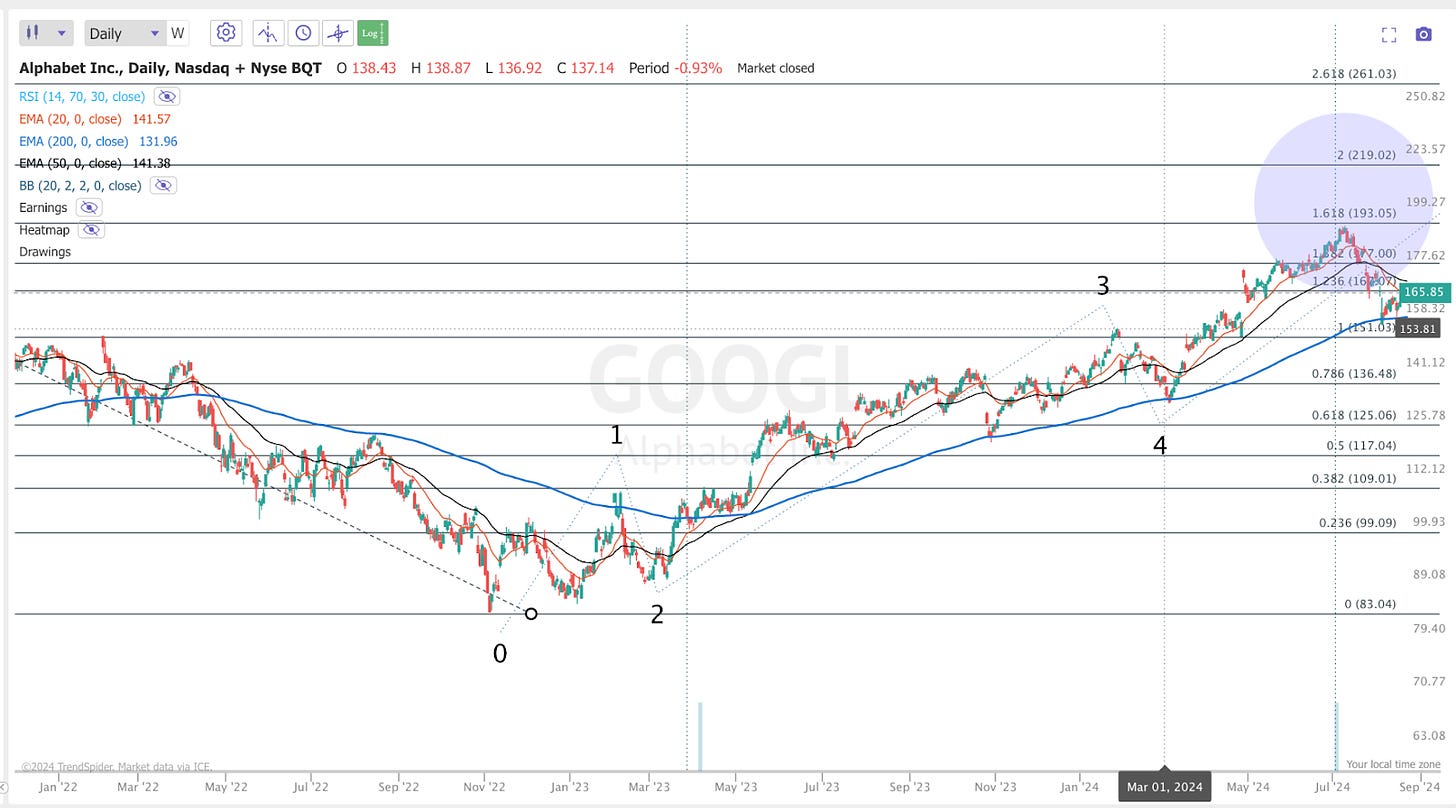
One thing I pointed out ahead of the sell-off from a couple of weeks ago, was that the Nasdaq and a lot of big tech names were reaching the 1.618 ext from their bear market lows.
What we did here was use the fib extension tool and measure from the top made back in 2022 to the lows of the bear market.
Notice how other fib levels have marked important areas of trade too, like the 0.786 ext.
Putting It All Together (My Algorithm)
Any of these indicators can be used on its own, or together, in order to determine good spots to buy stocks, add stop-losses and also take profits.
But hey, we live in the world of “AI”, so why not let the machines do the hard work for us?
Over the last three months, I have been developing an algorithm on TrendSpider that automatically gives us buy/sell alerts when triggered.
And here is the result; TADAA!
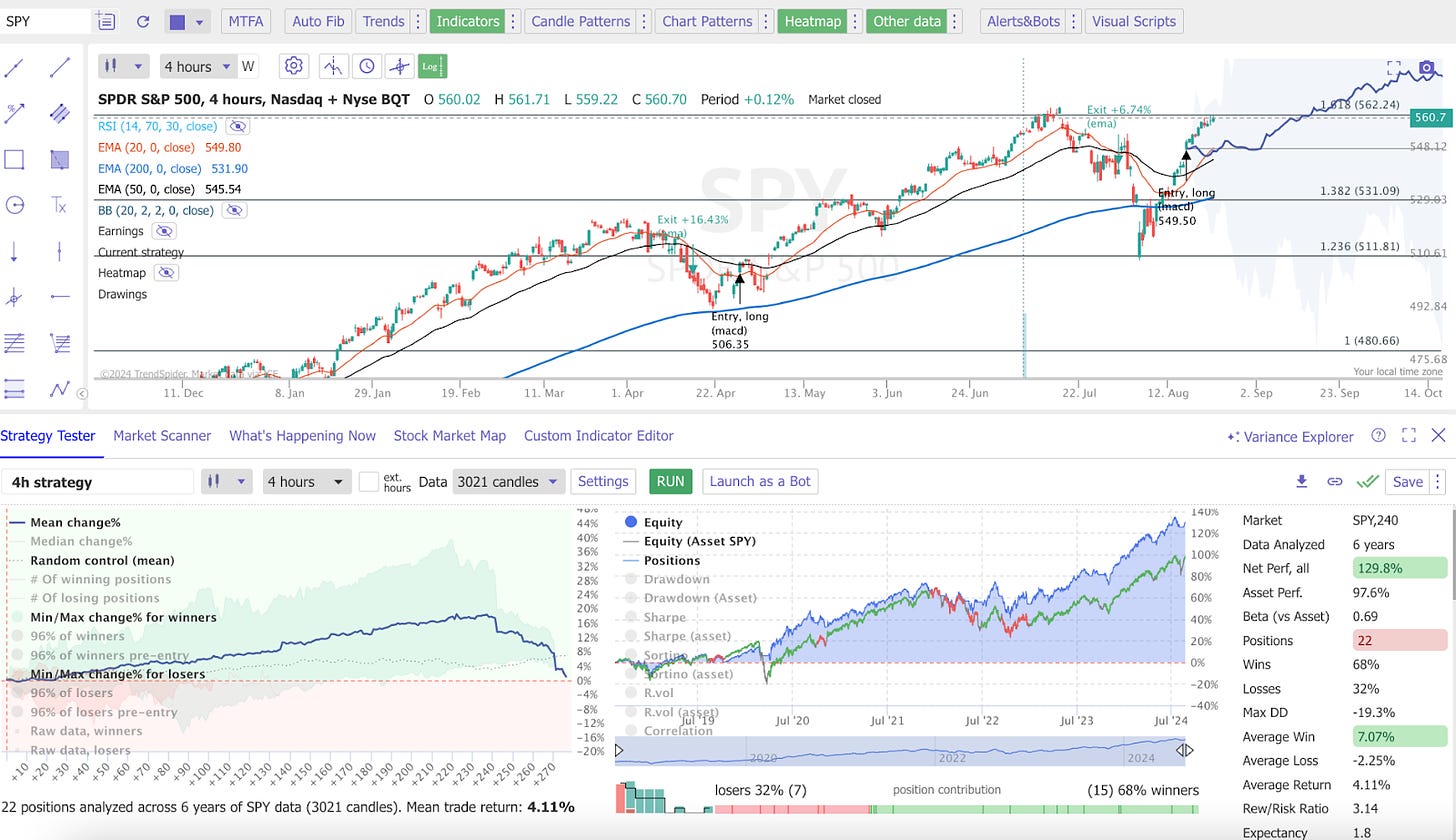
Using TS, I developed this algorithm, which uses MAs, MACD and RSI to determine good buy/exit points.
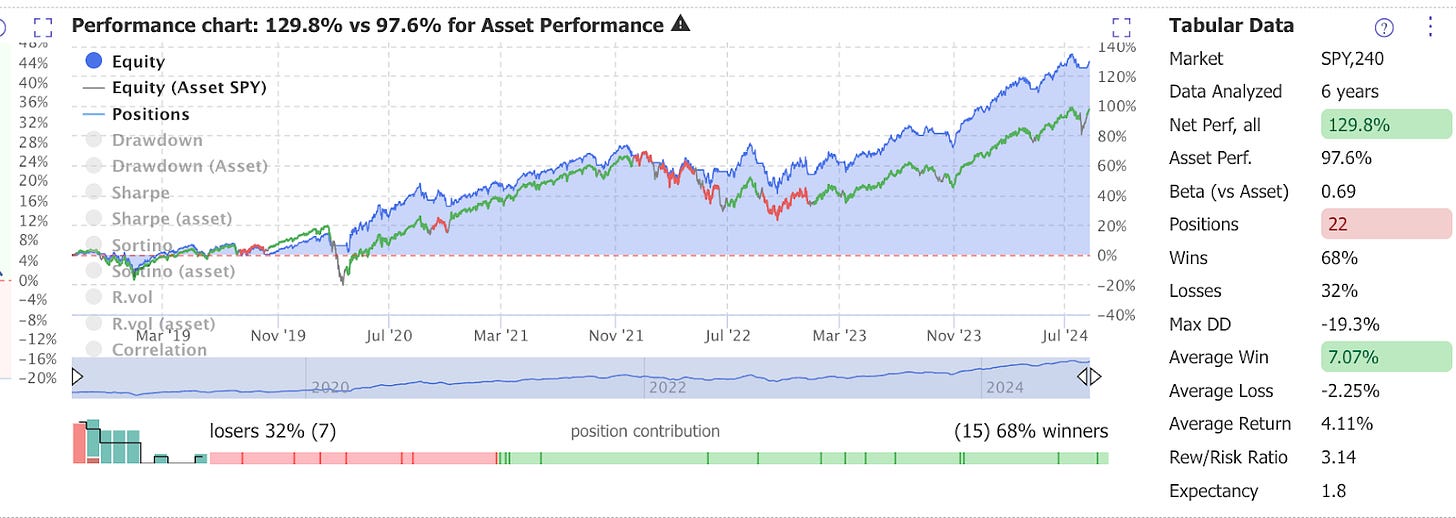
This algorithm has been back-tested over 5 years, and outperformed the S&P 500 by over 30%.
Moreover, it achieves this while also protecting you from downside.
As we can see, the strategy has a lower Beta than the asset. Out of 22 positions, 68% were winners and 32% losers, but by minimizing the average loss, -2.25% we have outperformed the index.
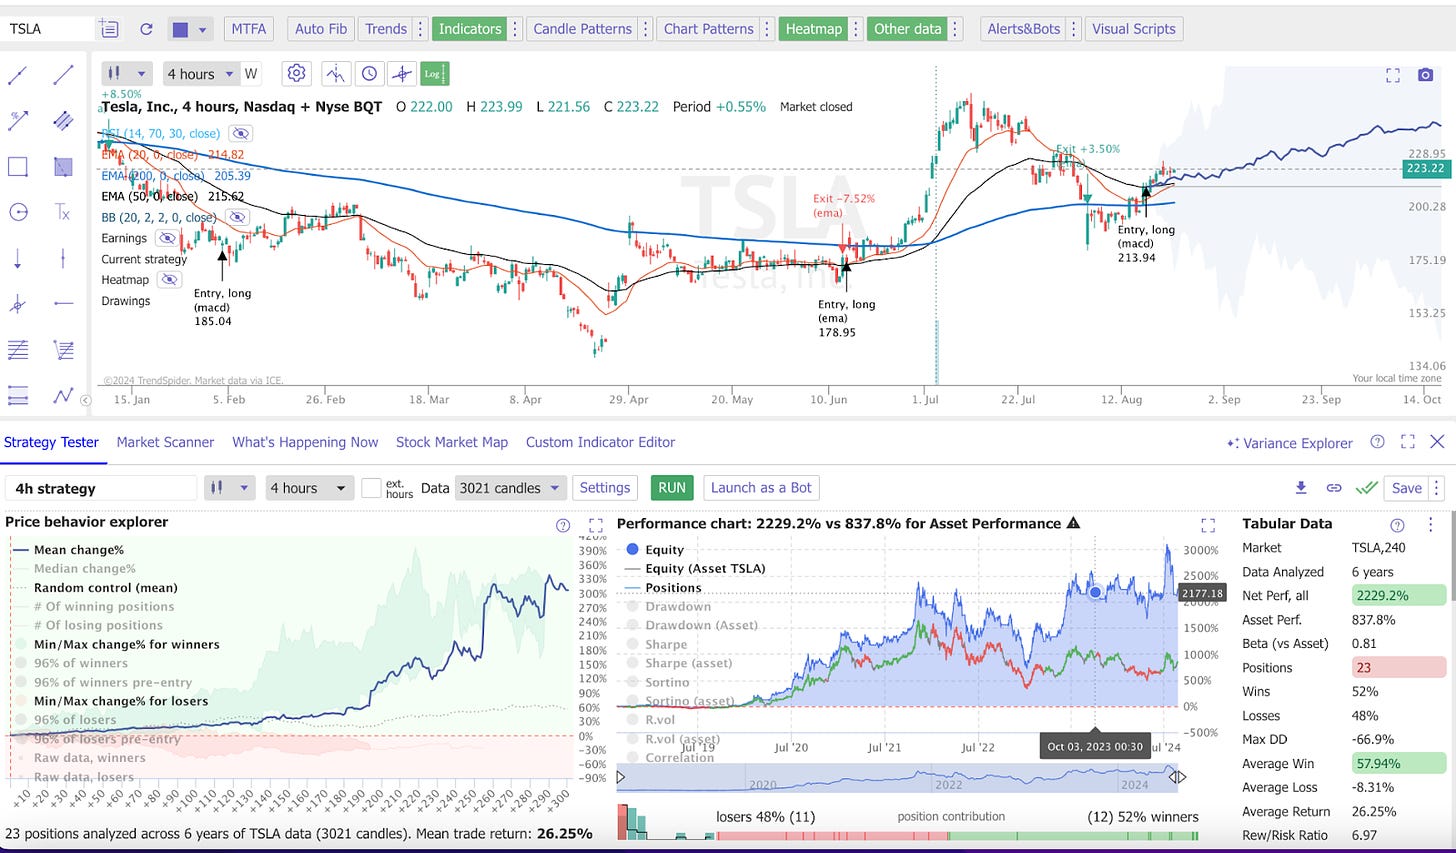
This algorithm also works for single stocks, even more volatile ones like Tesla.
The algorithm does well by itself, but even better when we also look at stuff like news catalysts, fundamentals, seasonality, and short interest and also apply Elliott Wave Theory and fib levels.
This is essentially what goes into my picks for the Swing Portfolio.
Final Thoughts
There’s a lot more to trading, such as risk management and emotions. However, I feel like we have covered some good basics here.
What comes next? I’ll give you a simple to-do list.
Learn, Learn, Learn; The information is all out there. I won’t pretend this is the only or even the best place for you to learn about trading.
If you haven’t already, get TrendSpider or another charting software.
Sign up to this substack in order to get some grade-A hand-holding
By subscribing to the sub, you will receive:
Access to my TrendSpider Algorithm
Swing Portfolio, Macro Trades and Also my stock portfolios.
Full in-depth research reports on stocks
Chat privileges and a direct line of contact with me
And, most importantly, my undying fidelity.
If you're interested in TS, you can try it here.
Sign-up using this link and I will also send you my algorithm, as well as a VERY hefty discount for the substack.
Thanks and best of luck,
James


