

Markets are at an inflexion point.
The technical picture I laid out last week has already started to resolve, in some cases confirming the bear thesis and, in one case, blowing up entirely.
Let’s go through what the charts are telling us right now.
S&P 500
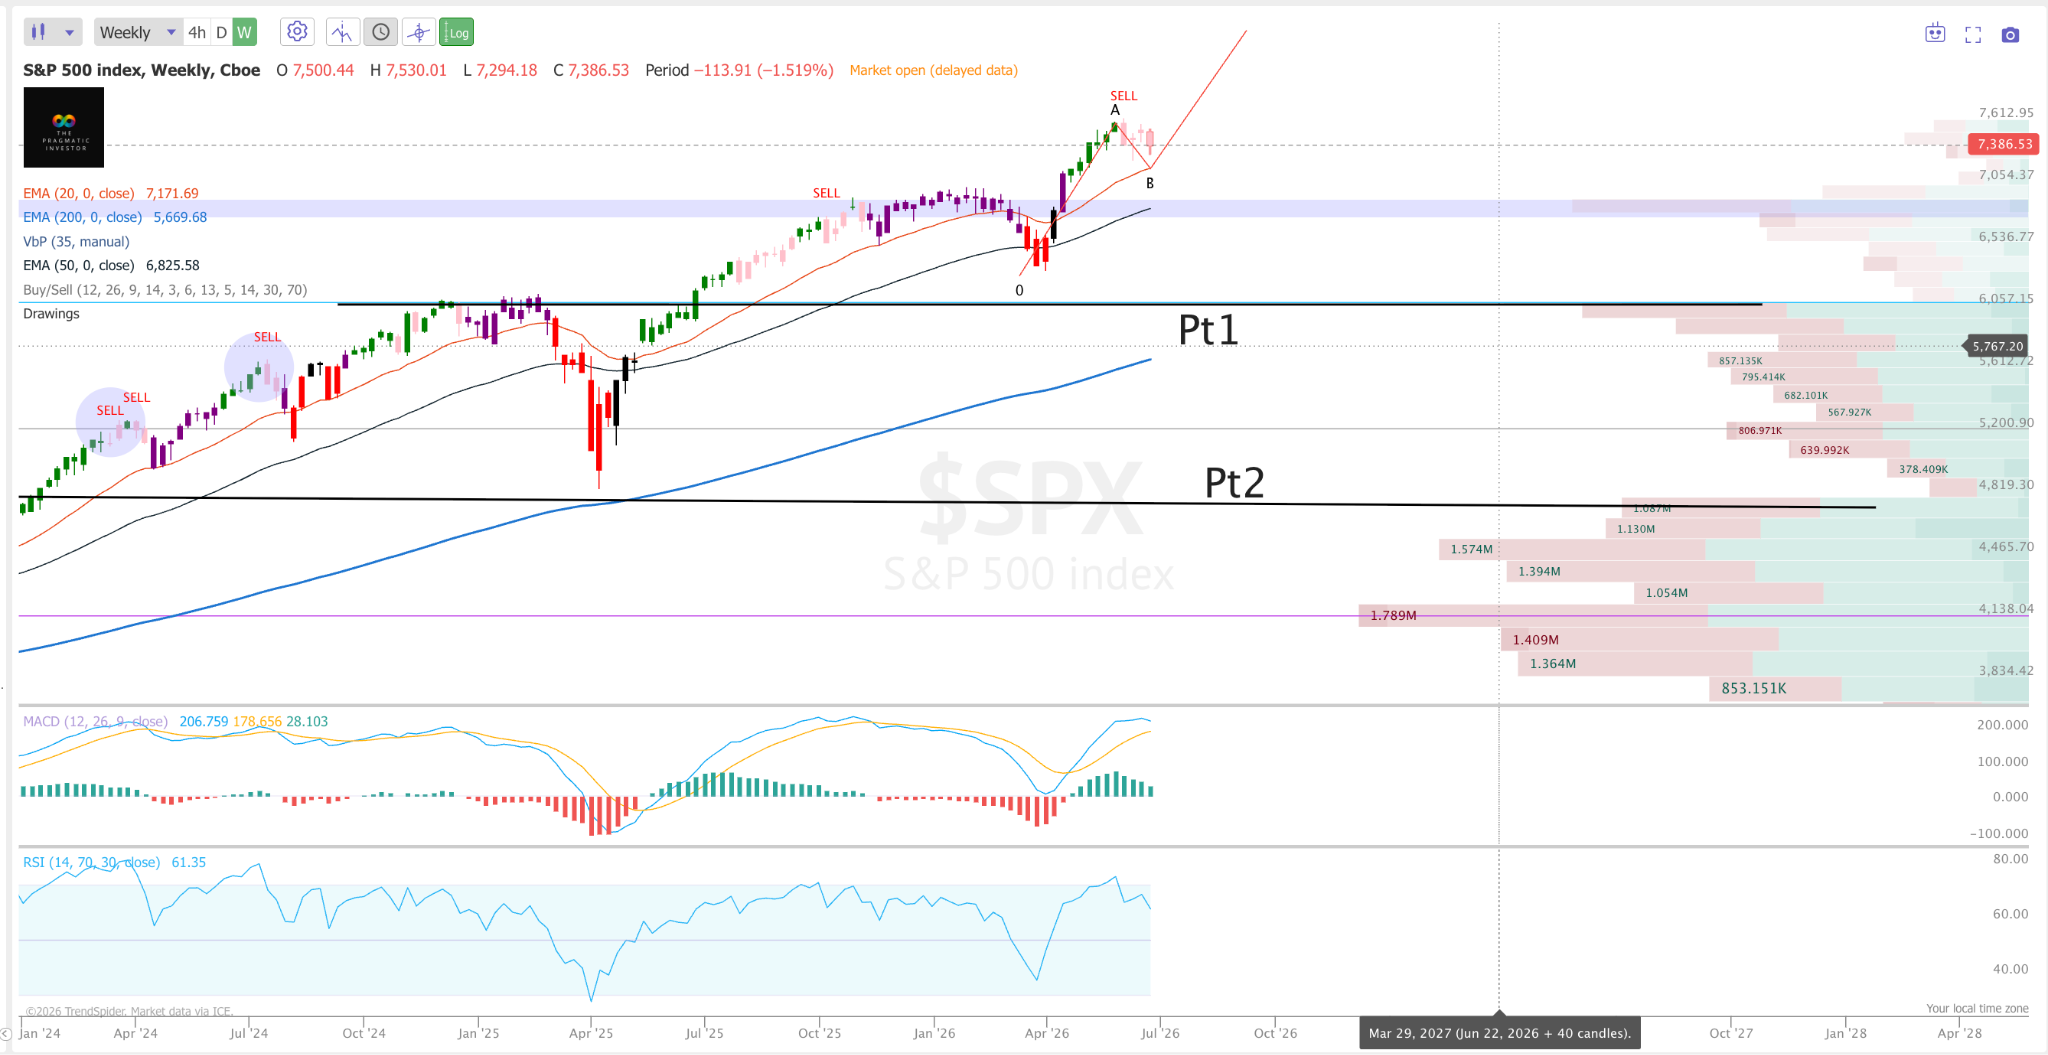
Our patented Buy/Sell Indicator has flashed a Sell signal, and paired with what we see in the 4h chart, this is quite ominous.
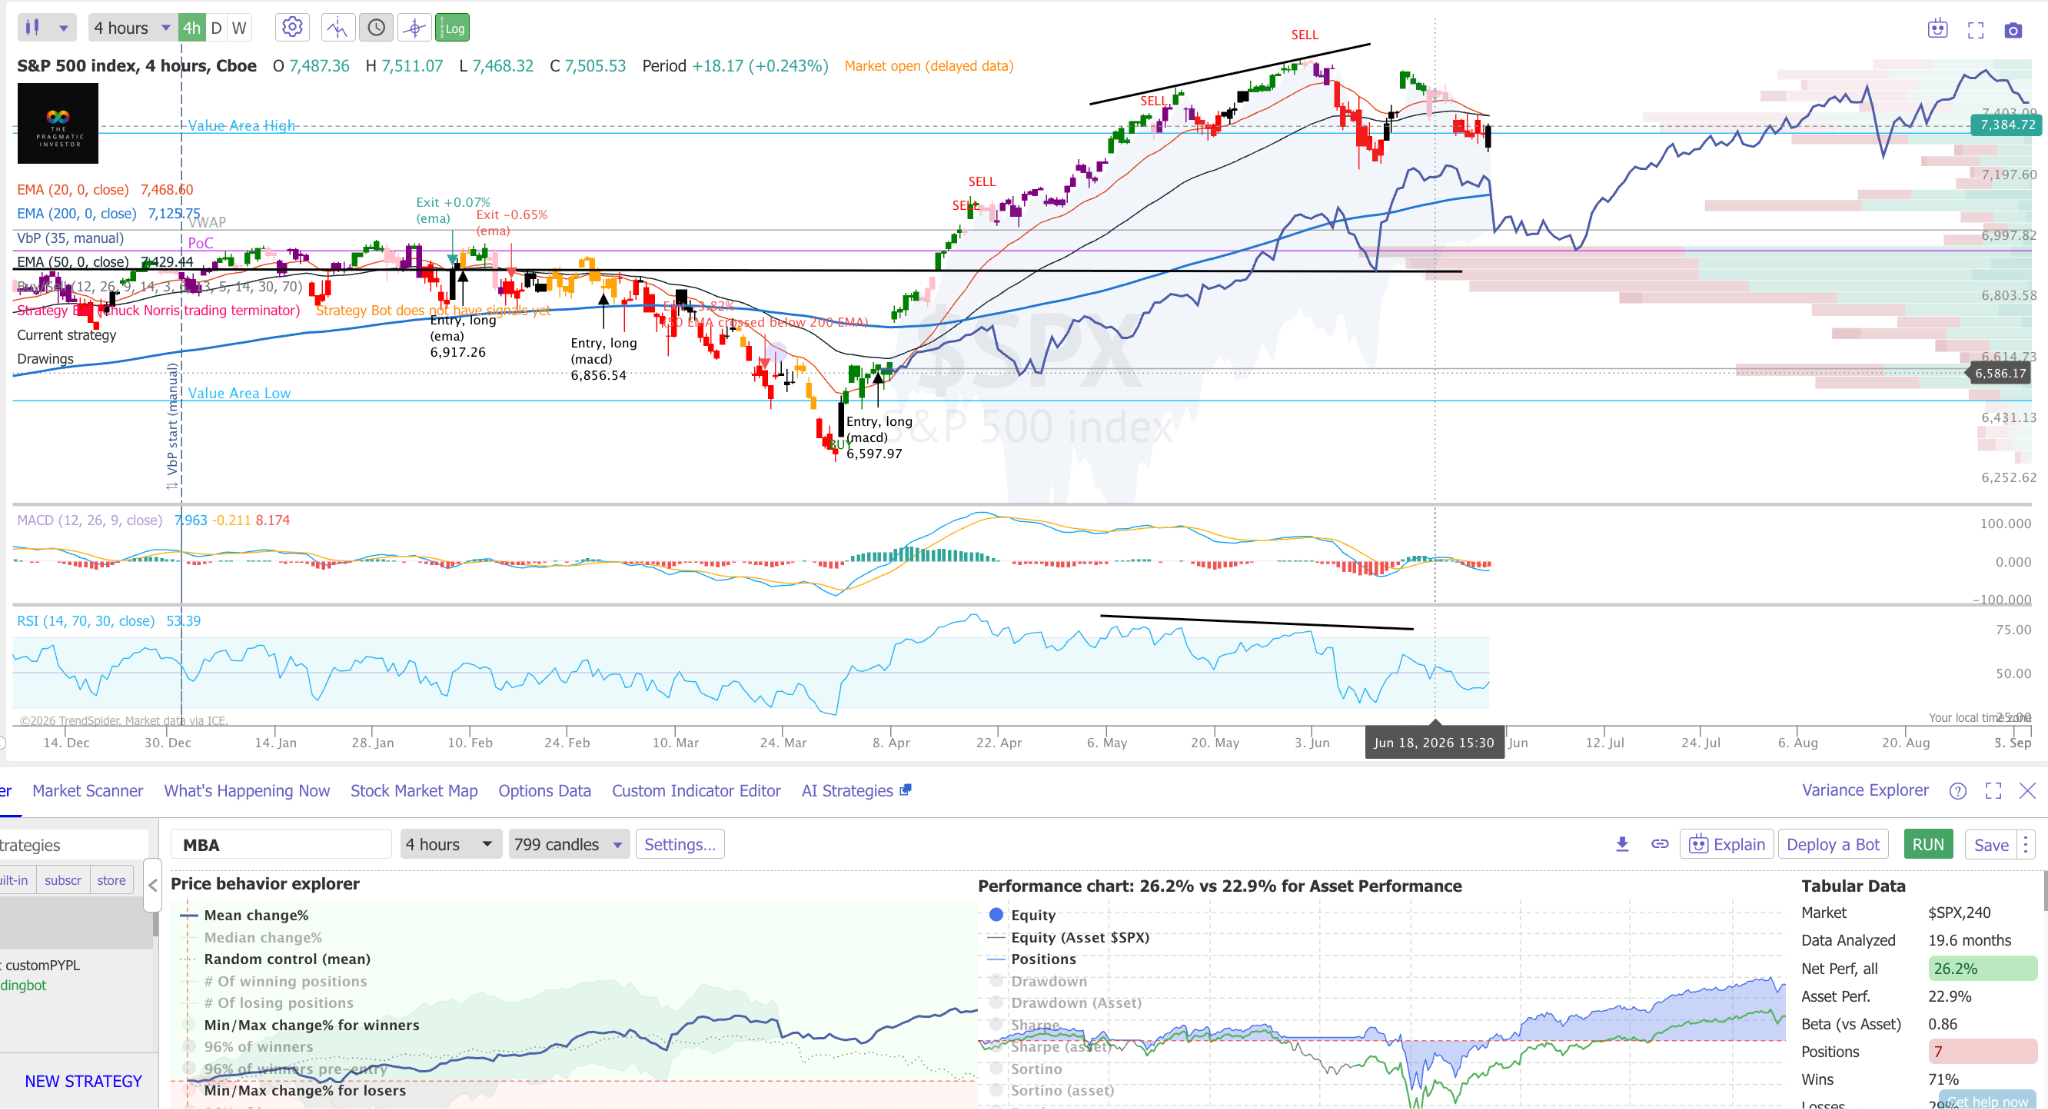
Our MBA has not yet flipped Sell, but it’s close as the 20 EMA looks to cross below the 50 EMA.
Nasdaq
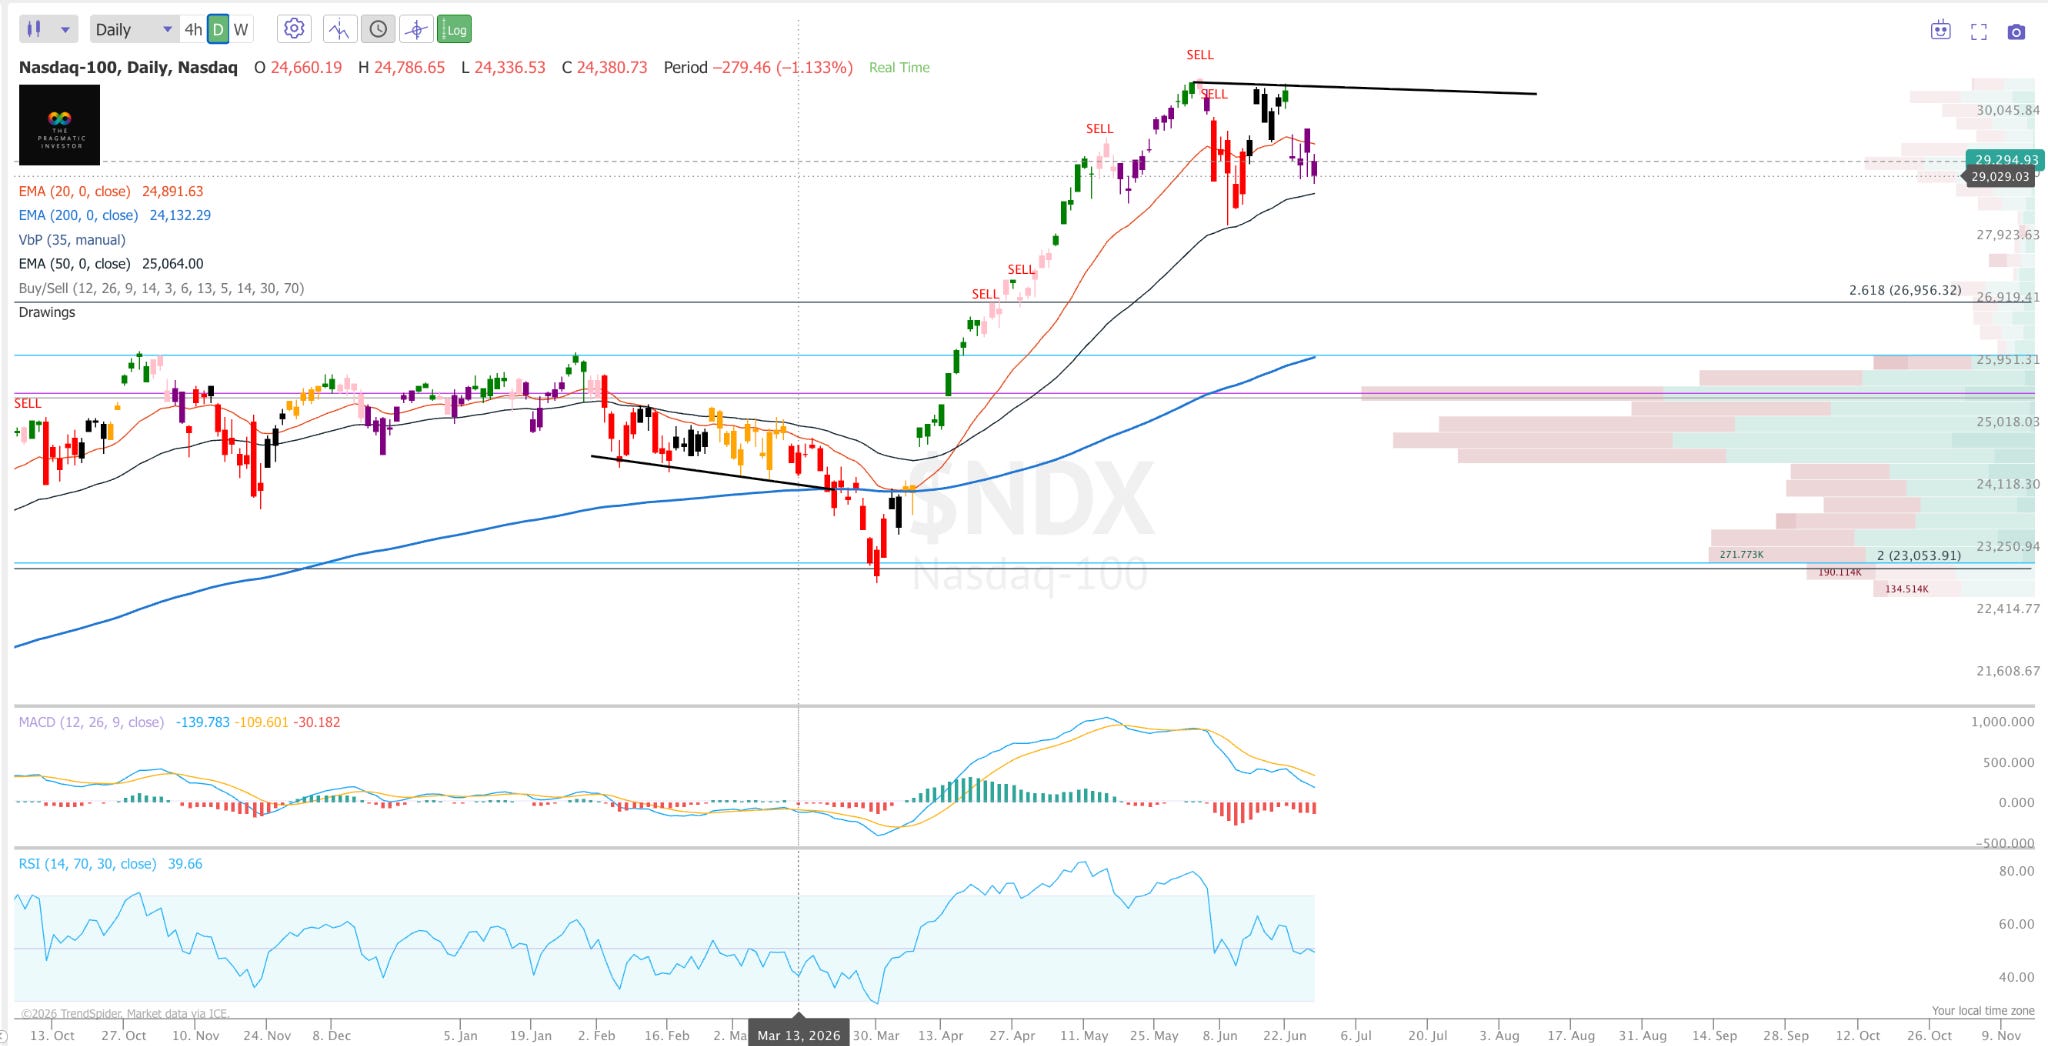
MACD is negative and falling. Multiple sell signals have fired across the daily chart from the June highs near 30,000, but these are on the daily chart, so they are less reliable.
We’ve formed a pretty ominous head and shoulders, and if we break support at the 20 EMA, then see you down at 25,000.
Bitcoin
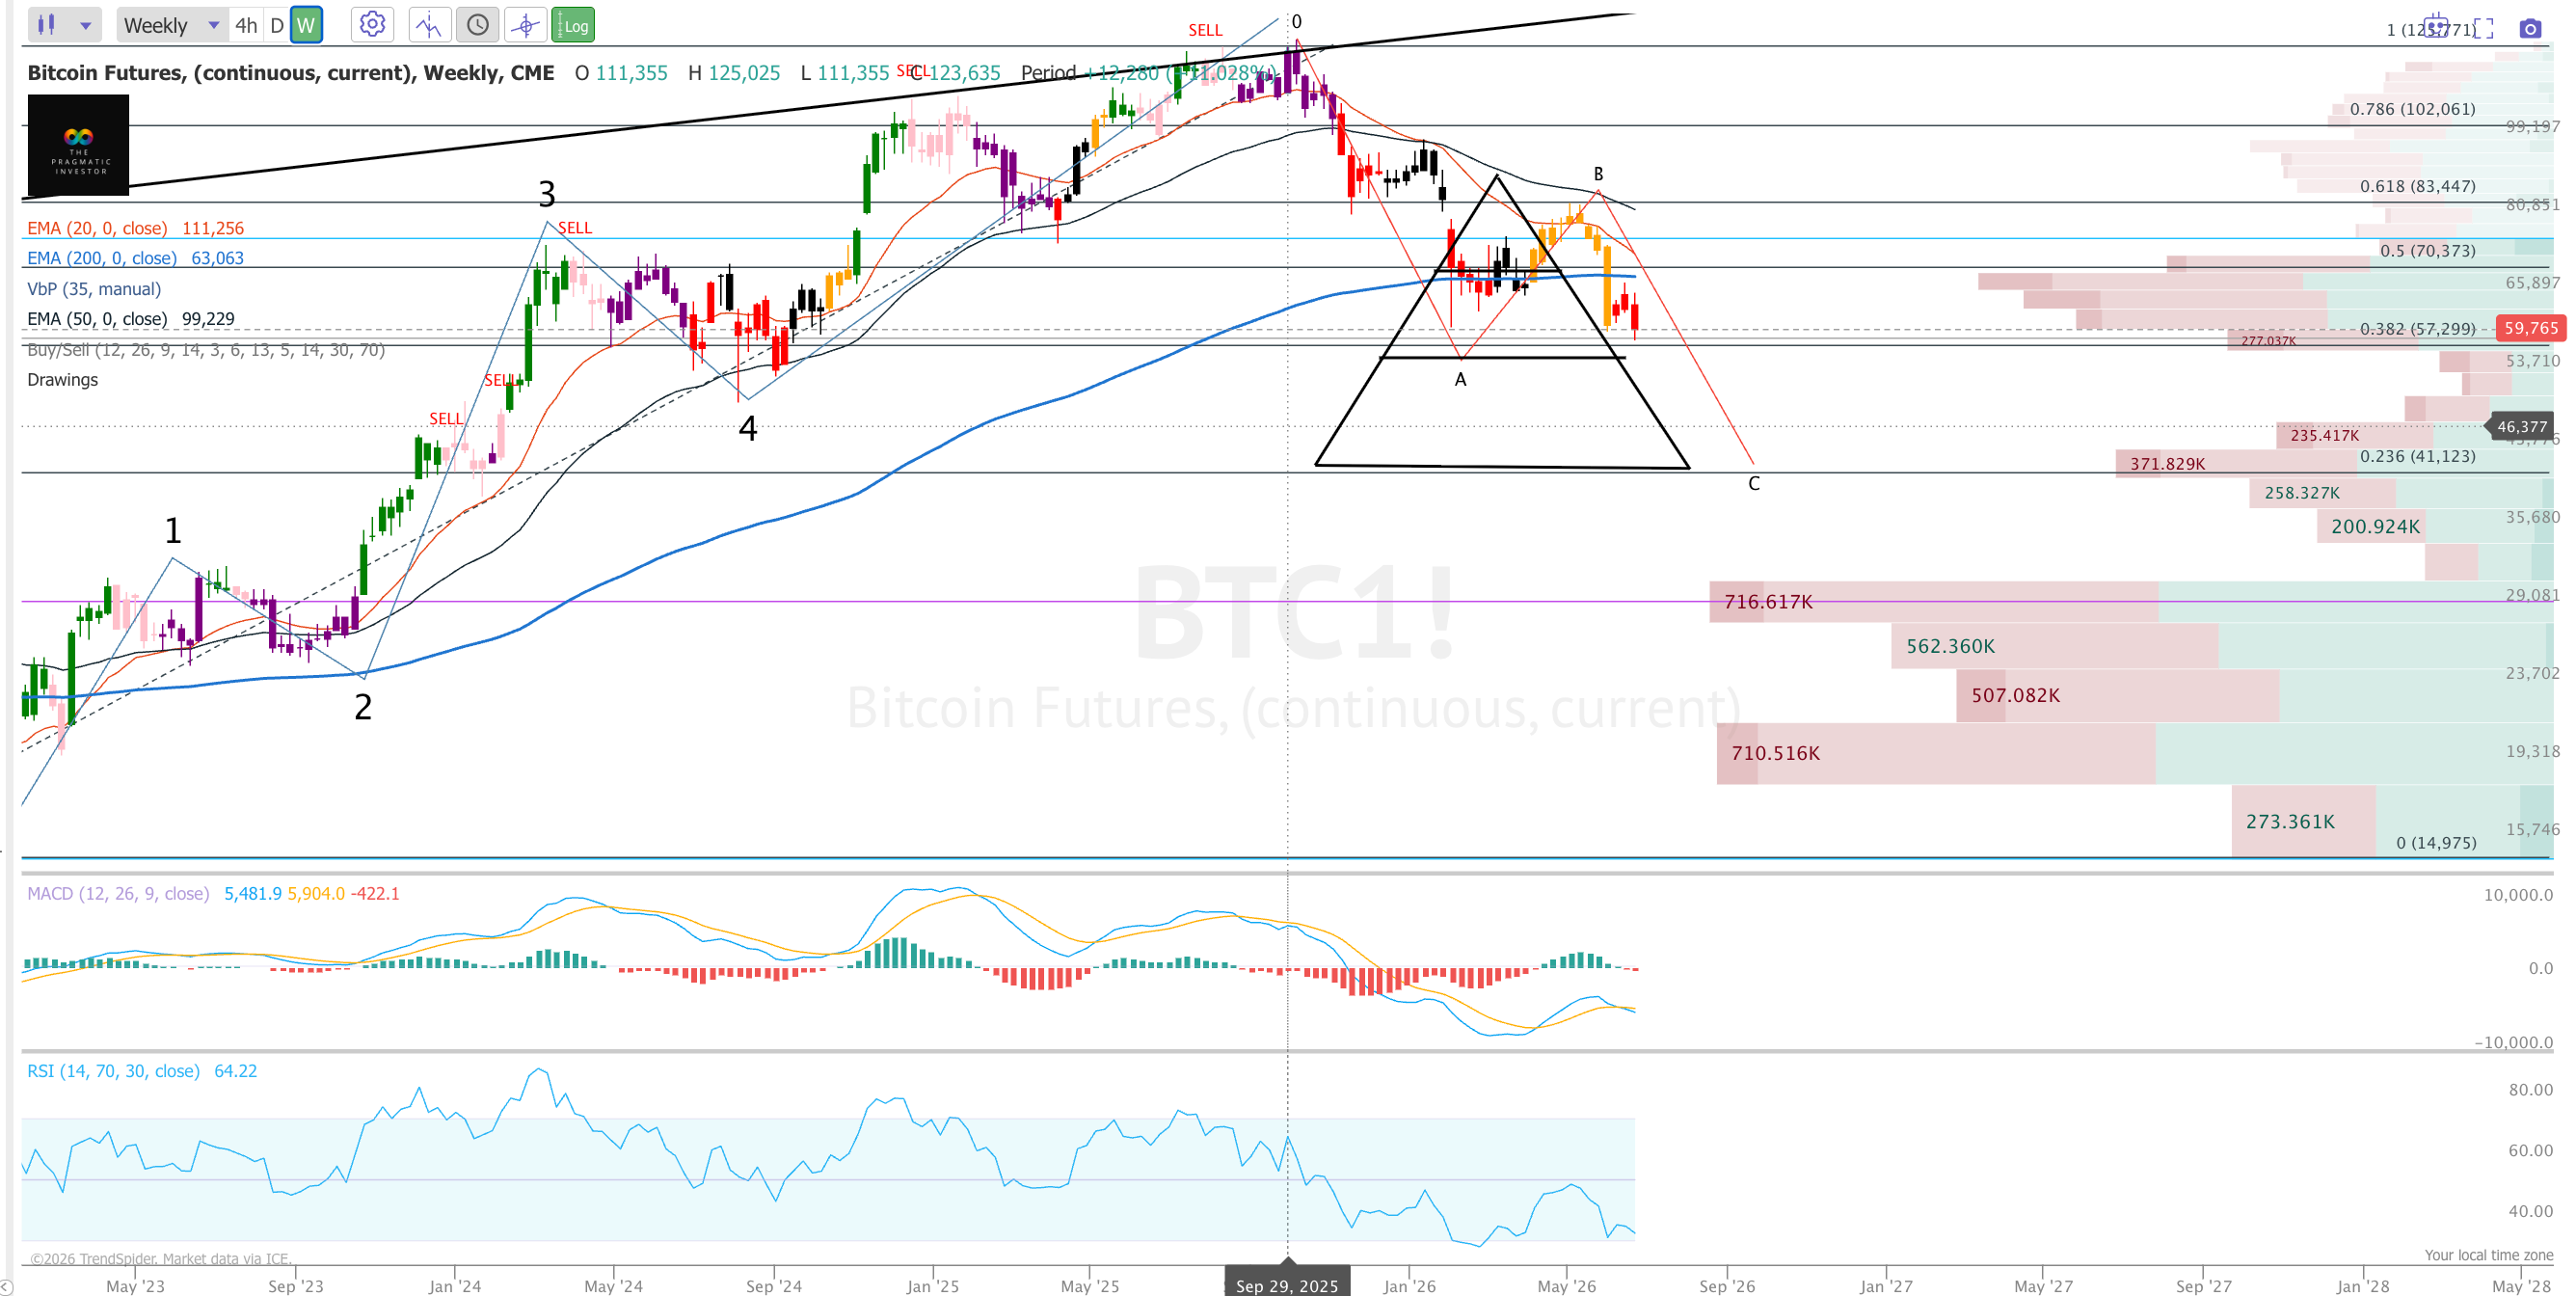
Completely breaking down, and sentiment is in the gutter here. It looks like this might actually cascade down to $40,000, and if that happens, I’m reallocating a full position to Bitcoin.
MAGS
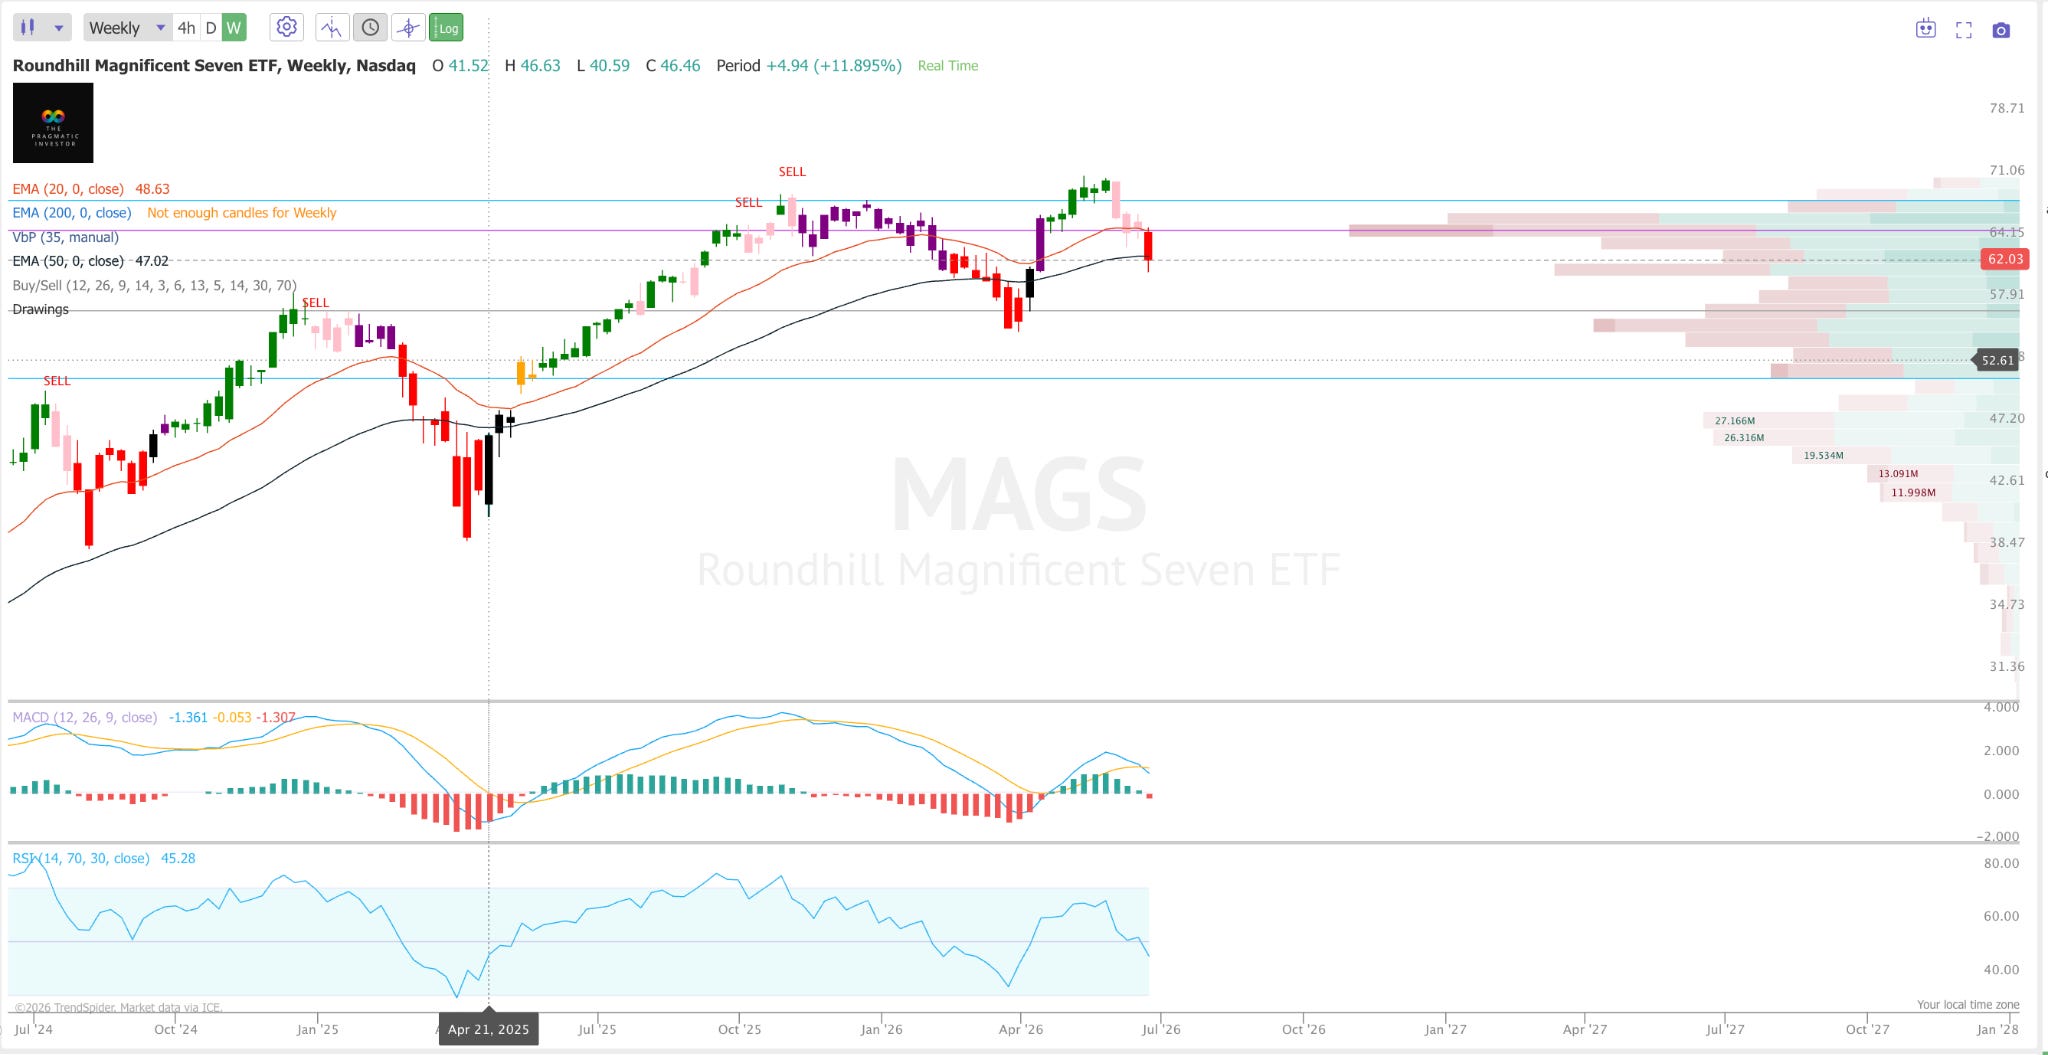
The Mags have been hit hard in the last few months, leading markets down, and it could get worse.
Bearish MACD cross and break of the 50 EMA.
DXY
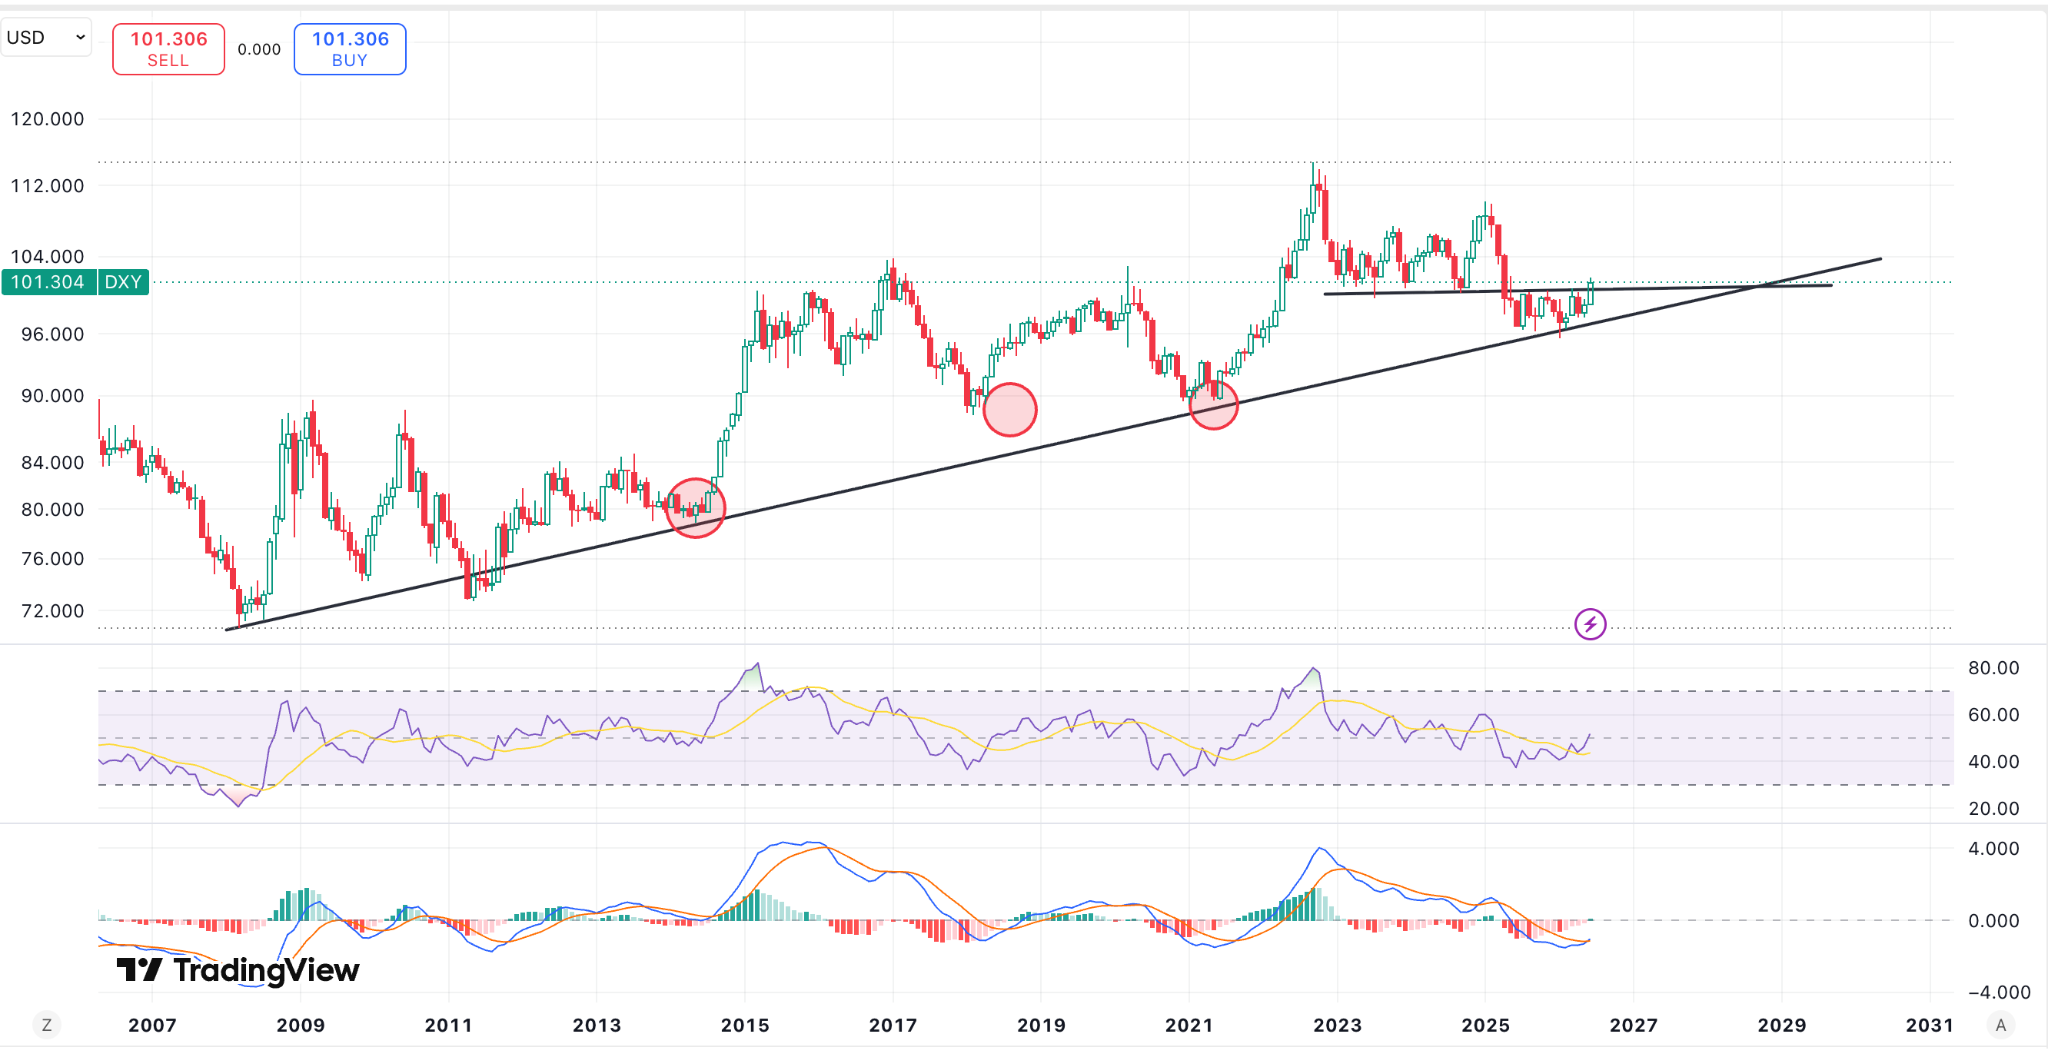
The DXY secular chart remains the anchor for everything else.
The long-term ascending trendline from 2008.
Three confirmed touches, three major dollar rallies, are still intact, and the dollar is holding just above 101, breaking out from the previous level of resistance.
The MACD and RSI on the long-term chart are both rising, with a bullish MACD flip, which also looks very bullish.
A bullish dollar is generally pretty bad for risk assets
GLD
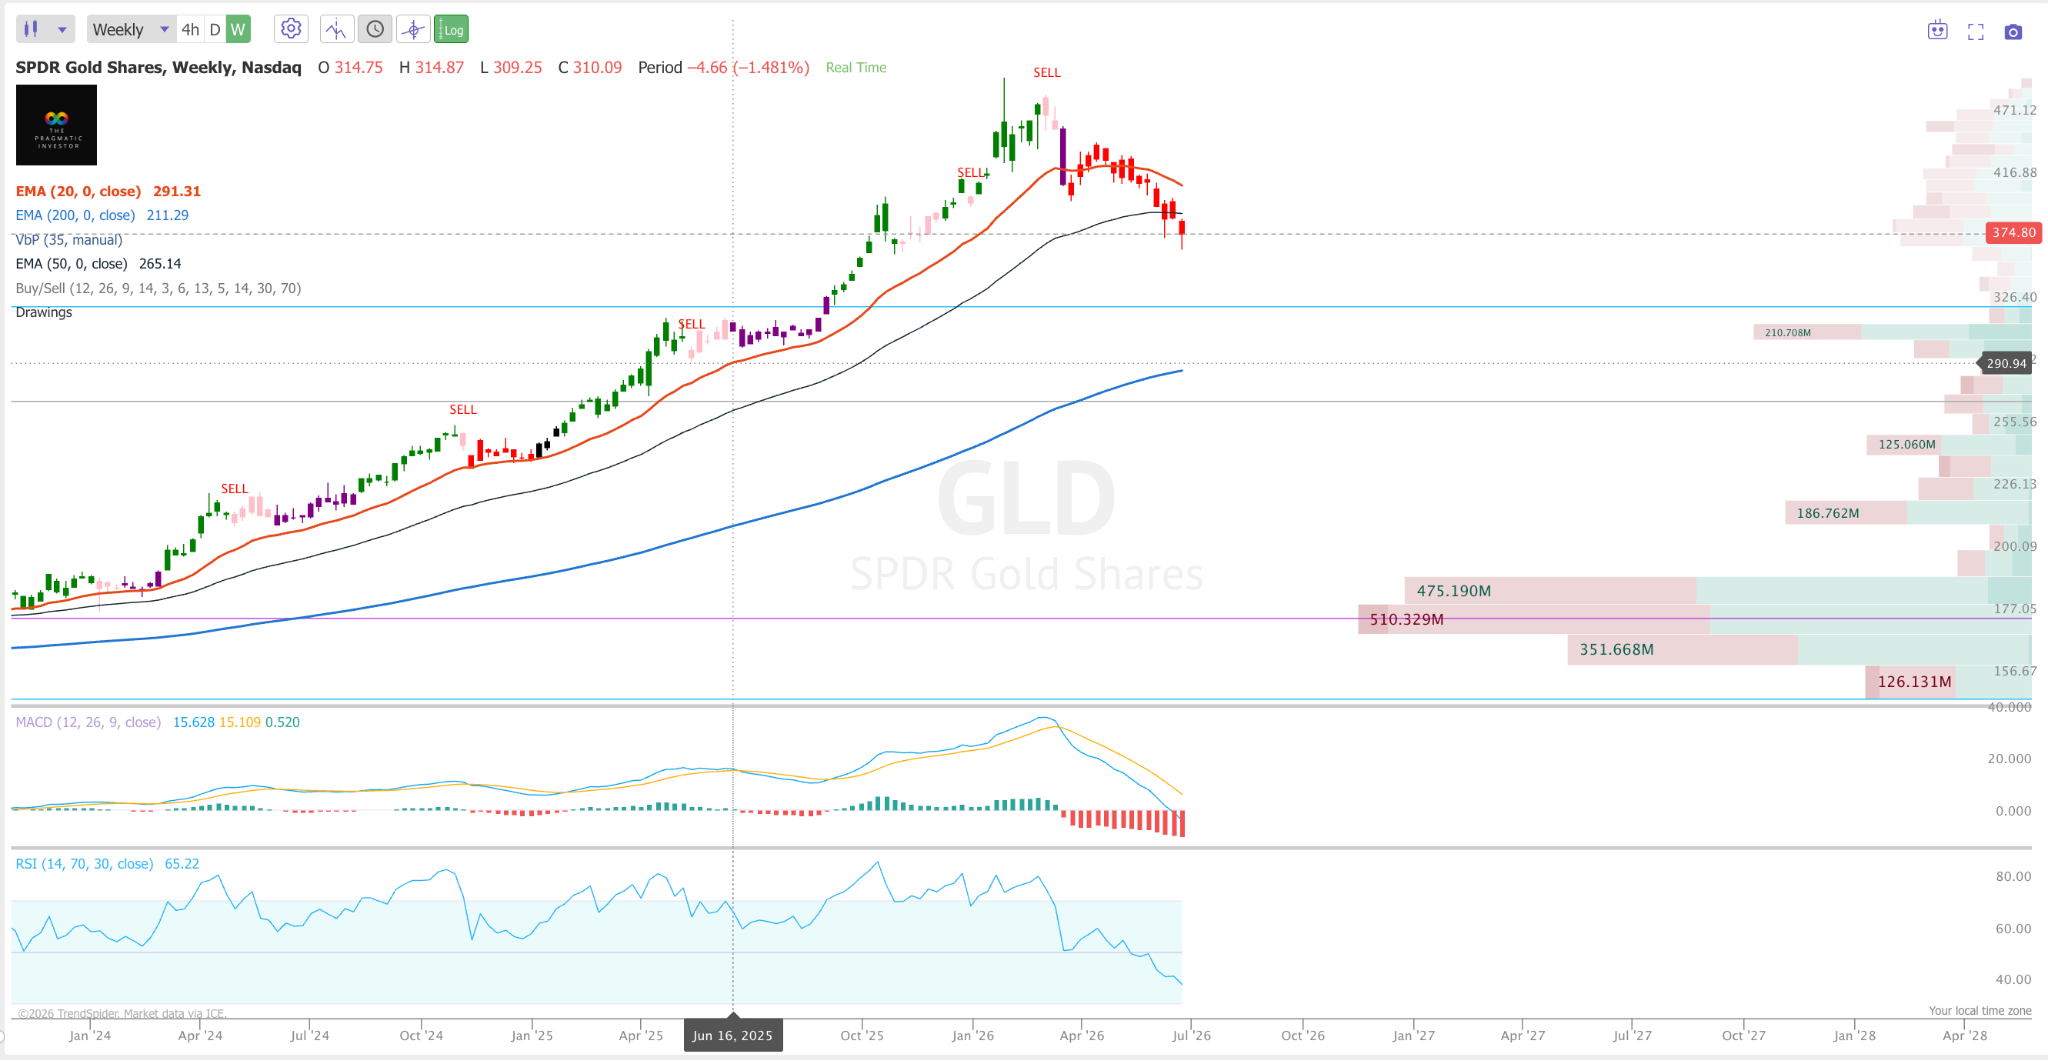
Weekly RSI has fallen to 65.22 from the overbought peaks, the MACD histogram is printing consecutive red bars, and the EMA20 at $291 is the first major support to watch.
The correction isn’t over, but this is a high-quality asset pulling back from a parabolic run. Somewhere between $291 and $265 I’d start paying attention to re-entry setups.
SLV
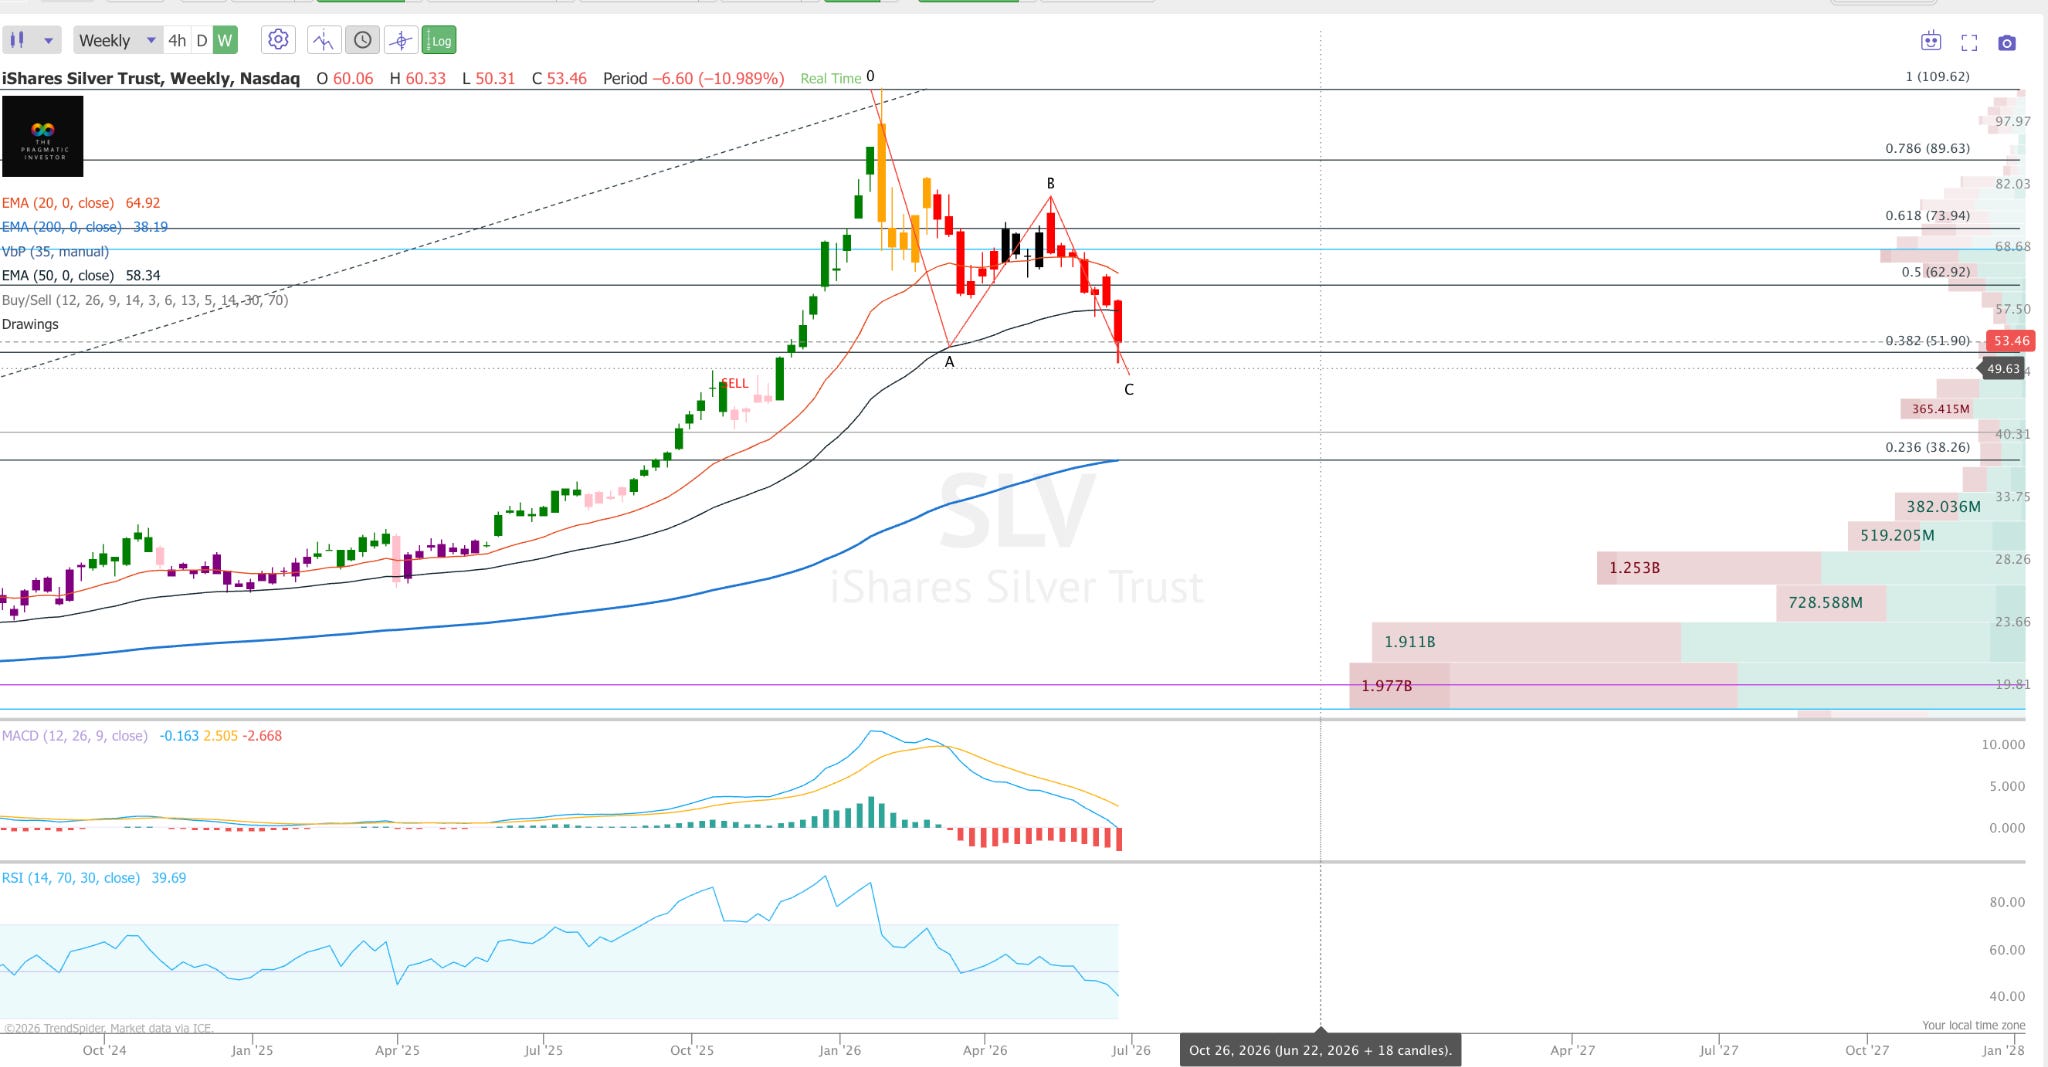
SLV looks like it wants to complete an ABC correction, but it could stil go much lower.
The 0.236 Fibonacci at $38.26 is the C-wave target. That’s still a meaningful downside from here. Silver is a trade, not a position right now.
USO
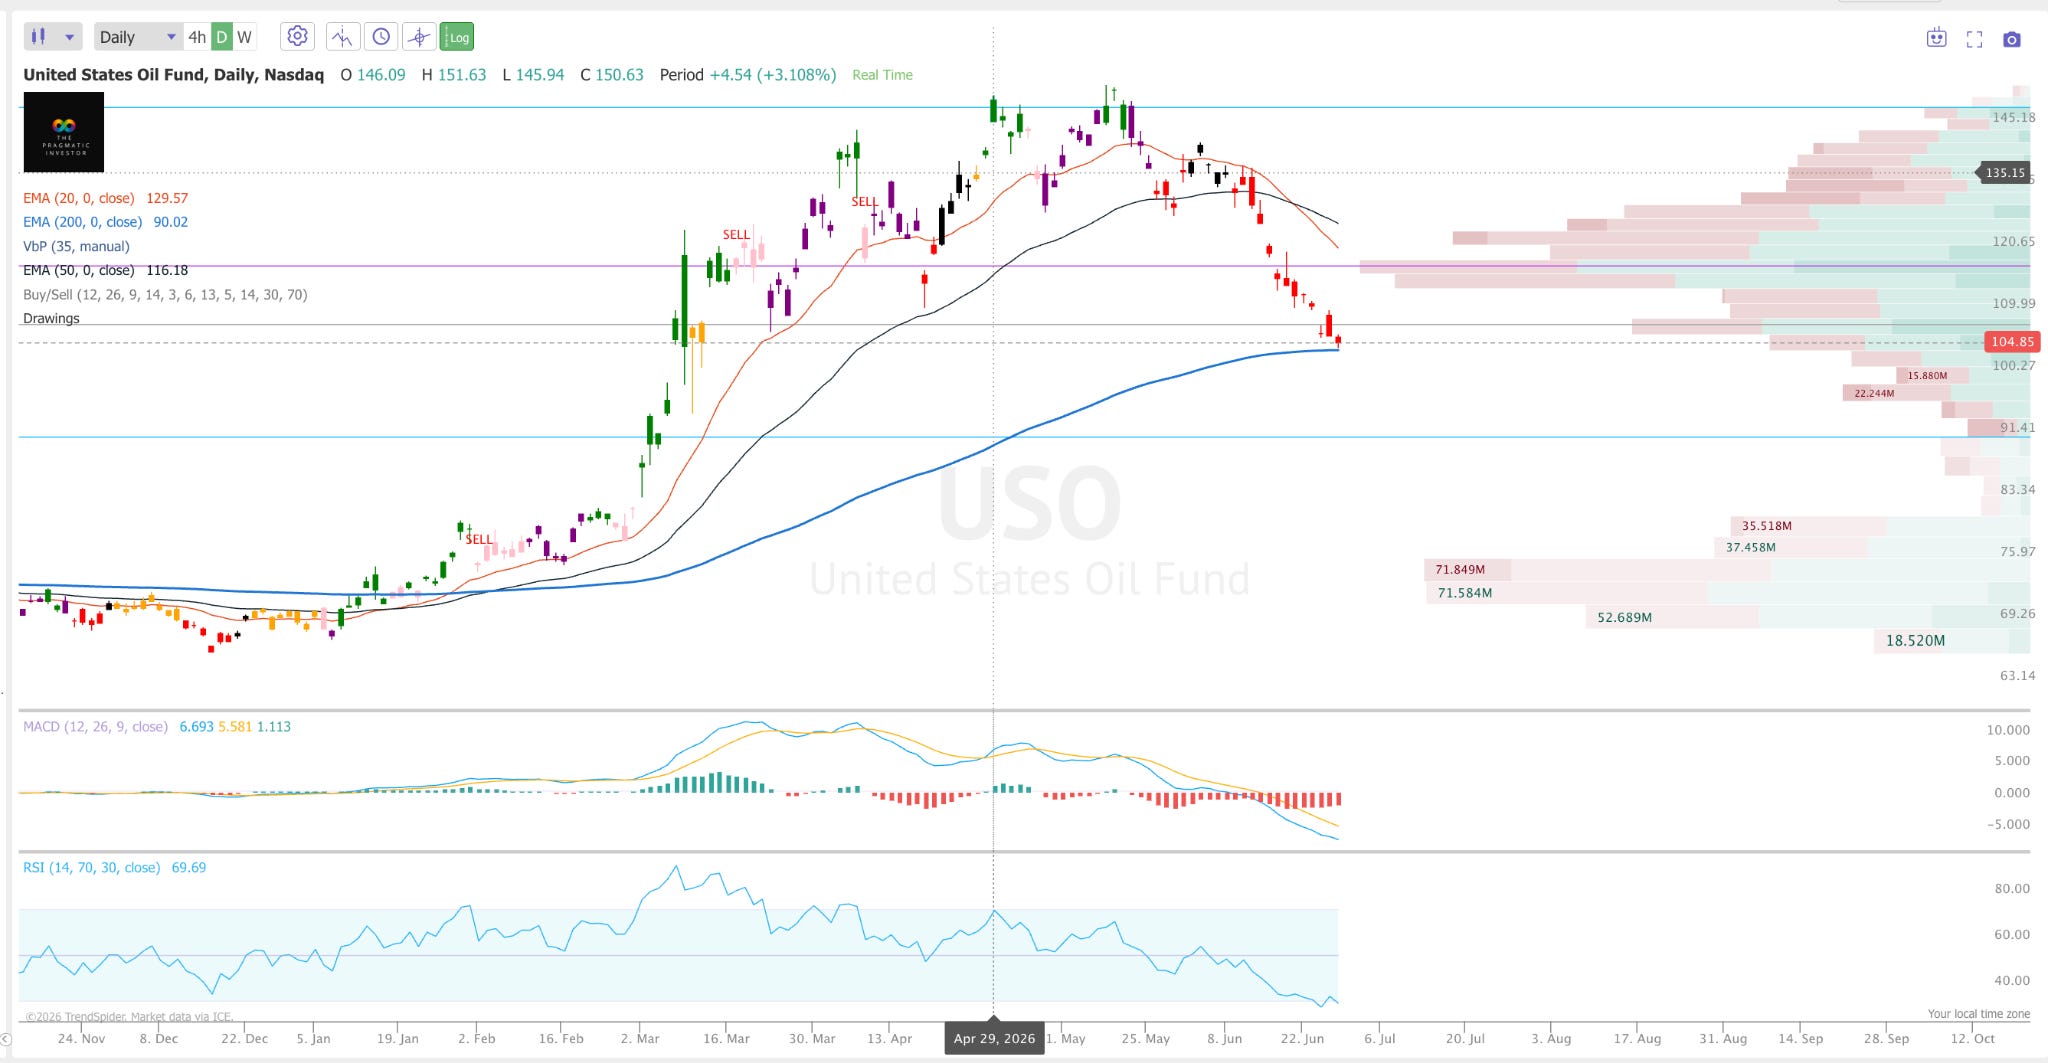
After peaking near $151, USO has collapsed to $104.85. MACD is deeply negative. RSI at 69.69, but that’s a stale read from earlier in the move; the price action tells the real story.
Dollar strength, demand concerns, and OPEC production noise. Whatever the narrative, the chart says oil is in a downtrend. Consistent with everything the dollar is signalling.
EEM
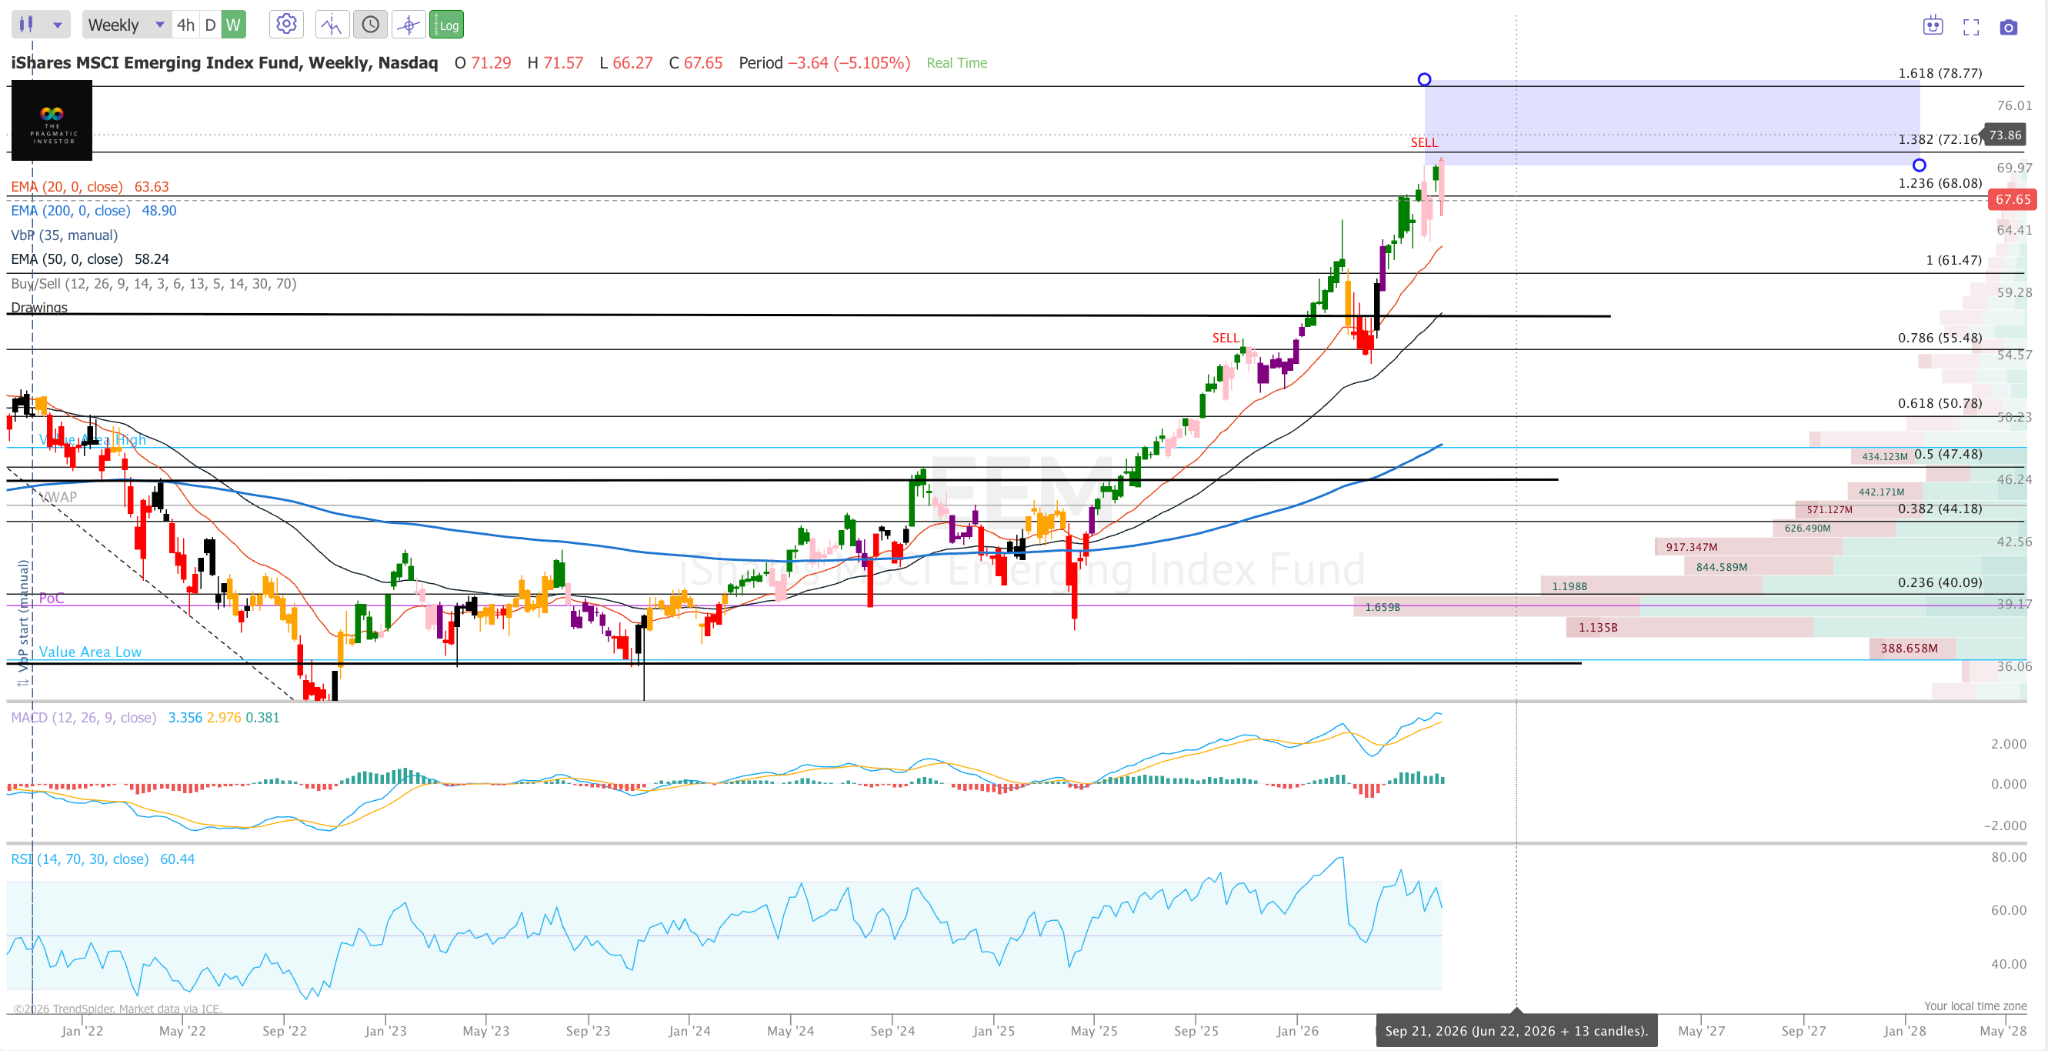
EEM pulled back 5.1% to $67.65 this week, testing the 1.236 Fibonacci at $68.08. RSI is 60.44, and MACD is still positive.
This is a healthy consolidation within a structural breakout, not a reversal.
However, with the dollar strengthening, a top could be in here, and our indicator clearly says Sell.
Final Thoughts
Most of the major indexes are flashing sell signals, and paired with what I’m seeing with AI, makes me quite worried.
Hey James. Looks like you're predicting a big drop in gold prices, for someone who bought gold near all time highs a few months ago (whoops), would you suggest riding it out or taking loss and waiting for those levels you mentioned?
Times like this really reinforce the notion that markets are actually just as likely to be irrational in either direction as they are likely to be rational.
How is the liquidity/macro picture looking? There must be some basis for the sell-off.